Skimle pour les études de marché et la connaissance client
Chaque répondant entendu. Chaque enseignement traçable. Chaque échéance tenue.
Conçu pour les instituts d'études qui livrent à des clients, et pour les équipes internes de connaissance client qui livrent au métier. Les deux subissent la même pression : les données qualitatives sont le signal le plus riche dont vous disposez, et il y en a bien trop pour être lues attentivement à la main. On demande aux instituts une analyse plus profonde en moins de temps et pour des honoraires moindres. On demande aux équipes internes de suivre le rythme de décisions produit et commerciales qui n'attendront pas quinze jours.
Skimle fait le codage mécanique qui dévore l'essentiel d'une semaine d'analyste. Vous faites l'interprétation, le « et alors ? » et la recommandation. Deux semaines de codage deviennent deux jours, et les nuances survivent à la compression.
Une analyse de niveau professionnel qui suit votre volume de recherche
60 entretiens approfondis, 8 groupes de discussion sur quatre marchés ou 5 000 verbatims NPS : le volume dépasse ce qu'on peut lire attentivement, et les outils superficiels perdent précisément les nuances sur lesquelles le client ou la direction commerciale vous interrogera. Skimle monte en charge sans sacrifier la profondeur.
- Traite entretiens, groupes de discussion, sondages ouverts, avis et tickets d'assistance dans un même projet
- Chaque thème relié à des citations clients textuelles, issues de l'ensemble des données et non d'un échantillon
- Analyse par segment intégrée : comparez selon le profil démographique, le niveau d'offre, la zone géographique ou la tranche de NPS
- Plus de 100 langues dans un même projet, sans étape de traduction
- Exports prêts à présenter vers Word, PowerPoint et Excel en quelques minutes
- Traçabilité complète, pour montrer exactement d'où vient chaque enseignement



DE CONVERSATIONS BRUTES À DES CONSTATS DÉFENDABLES
Analysez groupes de discussion et entretiens clients à grande échelle
Les groupes de discussion sont les données qualitatives les plus difficiles à analyser correctement. Un participant loquace ressemble en tout point à quatre voix indépendantes tant qu'on ne suit pas les preuves. Les entretiens approfondis échouent autrement : à 20, 40 ou 60 transcriptions, le goulot d'étranglement devient de coder la dernière comme on a codé la première. Skimle construit une seule structure thématique sur l'ensemble des séances et montre ce qui était constant, ce qui variait selon le segment et ce qui relevait d'un cas isolé — pour que le constat tienne quand un client ou une partie prenante le conteste.
Comment ça marche
- 1. Importez chaque séance comme un document
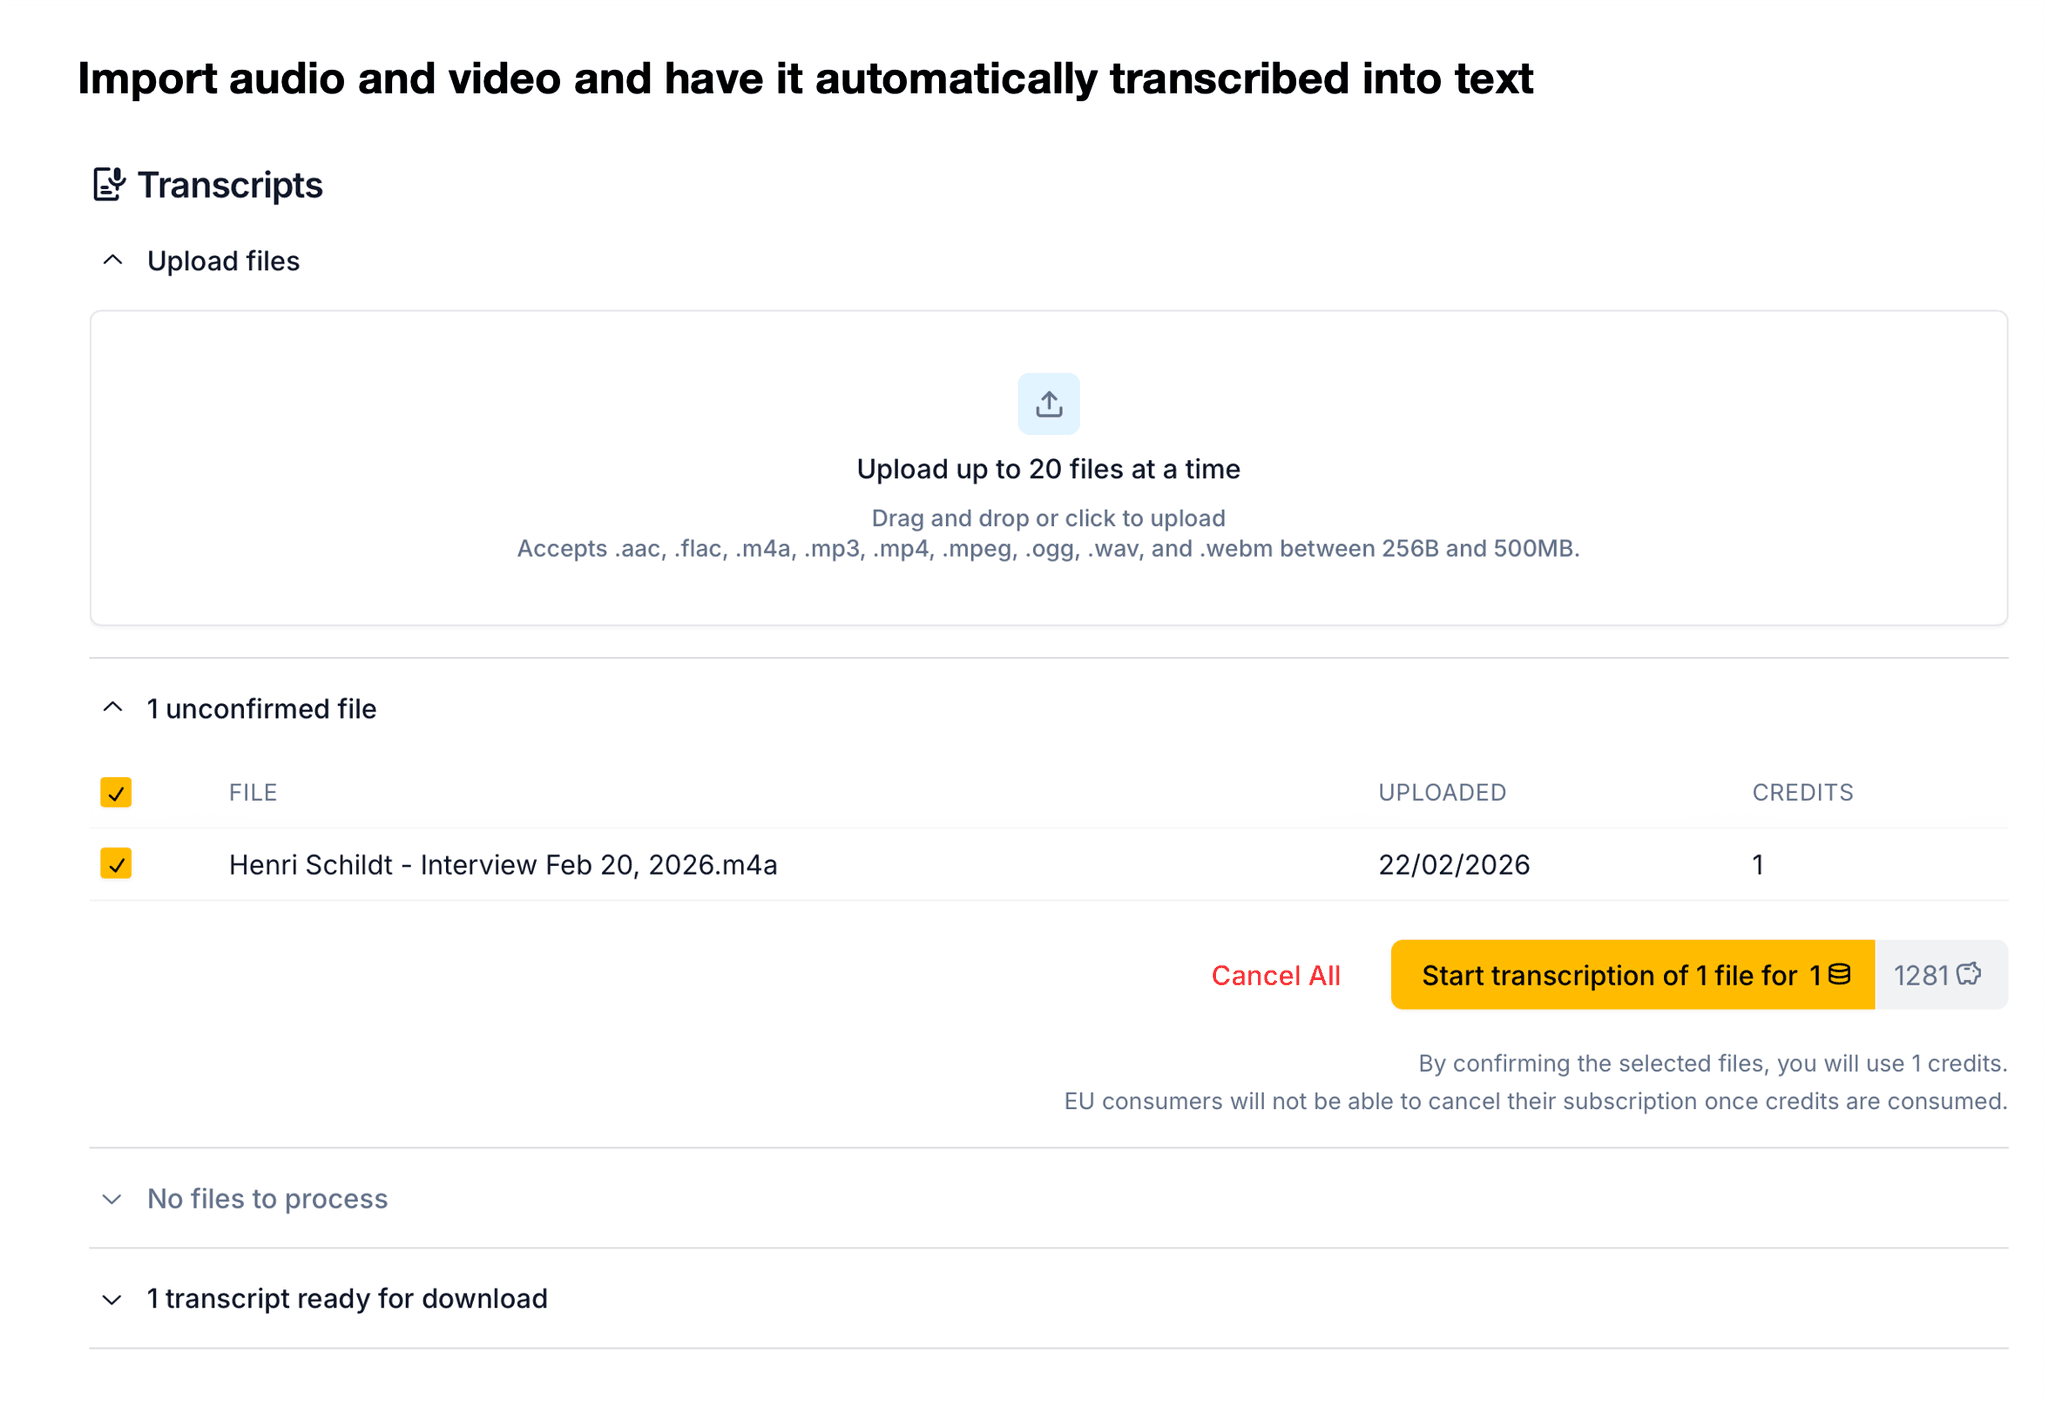
Importez les transcriptions ou les enregistrements issus de Zoom, Teams, Otter ou Fireflies. Skimle transcrit directement l'audio et la vidéo : chaque séance devient un document prêt à analyser.
- 2. Lancez l'analyse sur toutes les séances
Skimle lit chaque transcription et construit les thèmes à partir du contenu, sur toutes les séances. Il découvre ce qui a réellement été dit au lieu d'imposer une grille de codage préétablie.
- 3. Voyez ce qui est constant et ce qui varie
Chaque thème indique quels groupes y ont contribué et à quelle fréquence, ce qui distingue le signal universel d'une seule séance ou d'un seul marché.
- 4. Évaluez la répartition des preuves
Cliquez sur n'importe quel thème pour lire les citations qui l'appuient et voir de quelles séances elles proviennent. Vous jugez les effets de voix dominante directement, et non de mémoire.
- 5. Exportez pour le client
Générez le document de synthèse avec des citations représentatives par groupe, prêt pour la présentation ou le rapport complet.



QUELS THÈMES COMPTENT POUR QUELS CLIENTS ?
Coder les réponses ouvertes et comparer d'un segment à l'autre
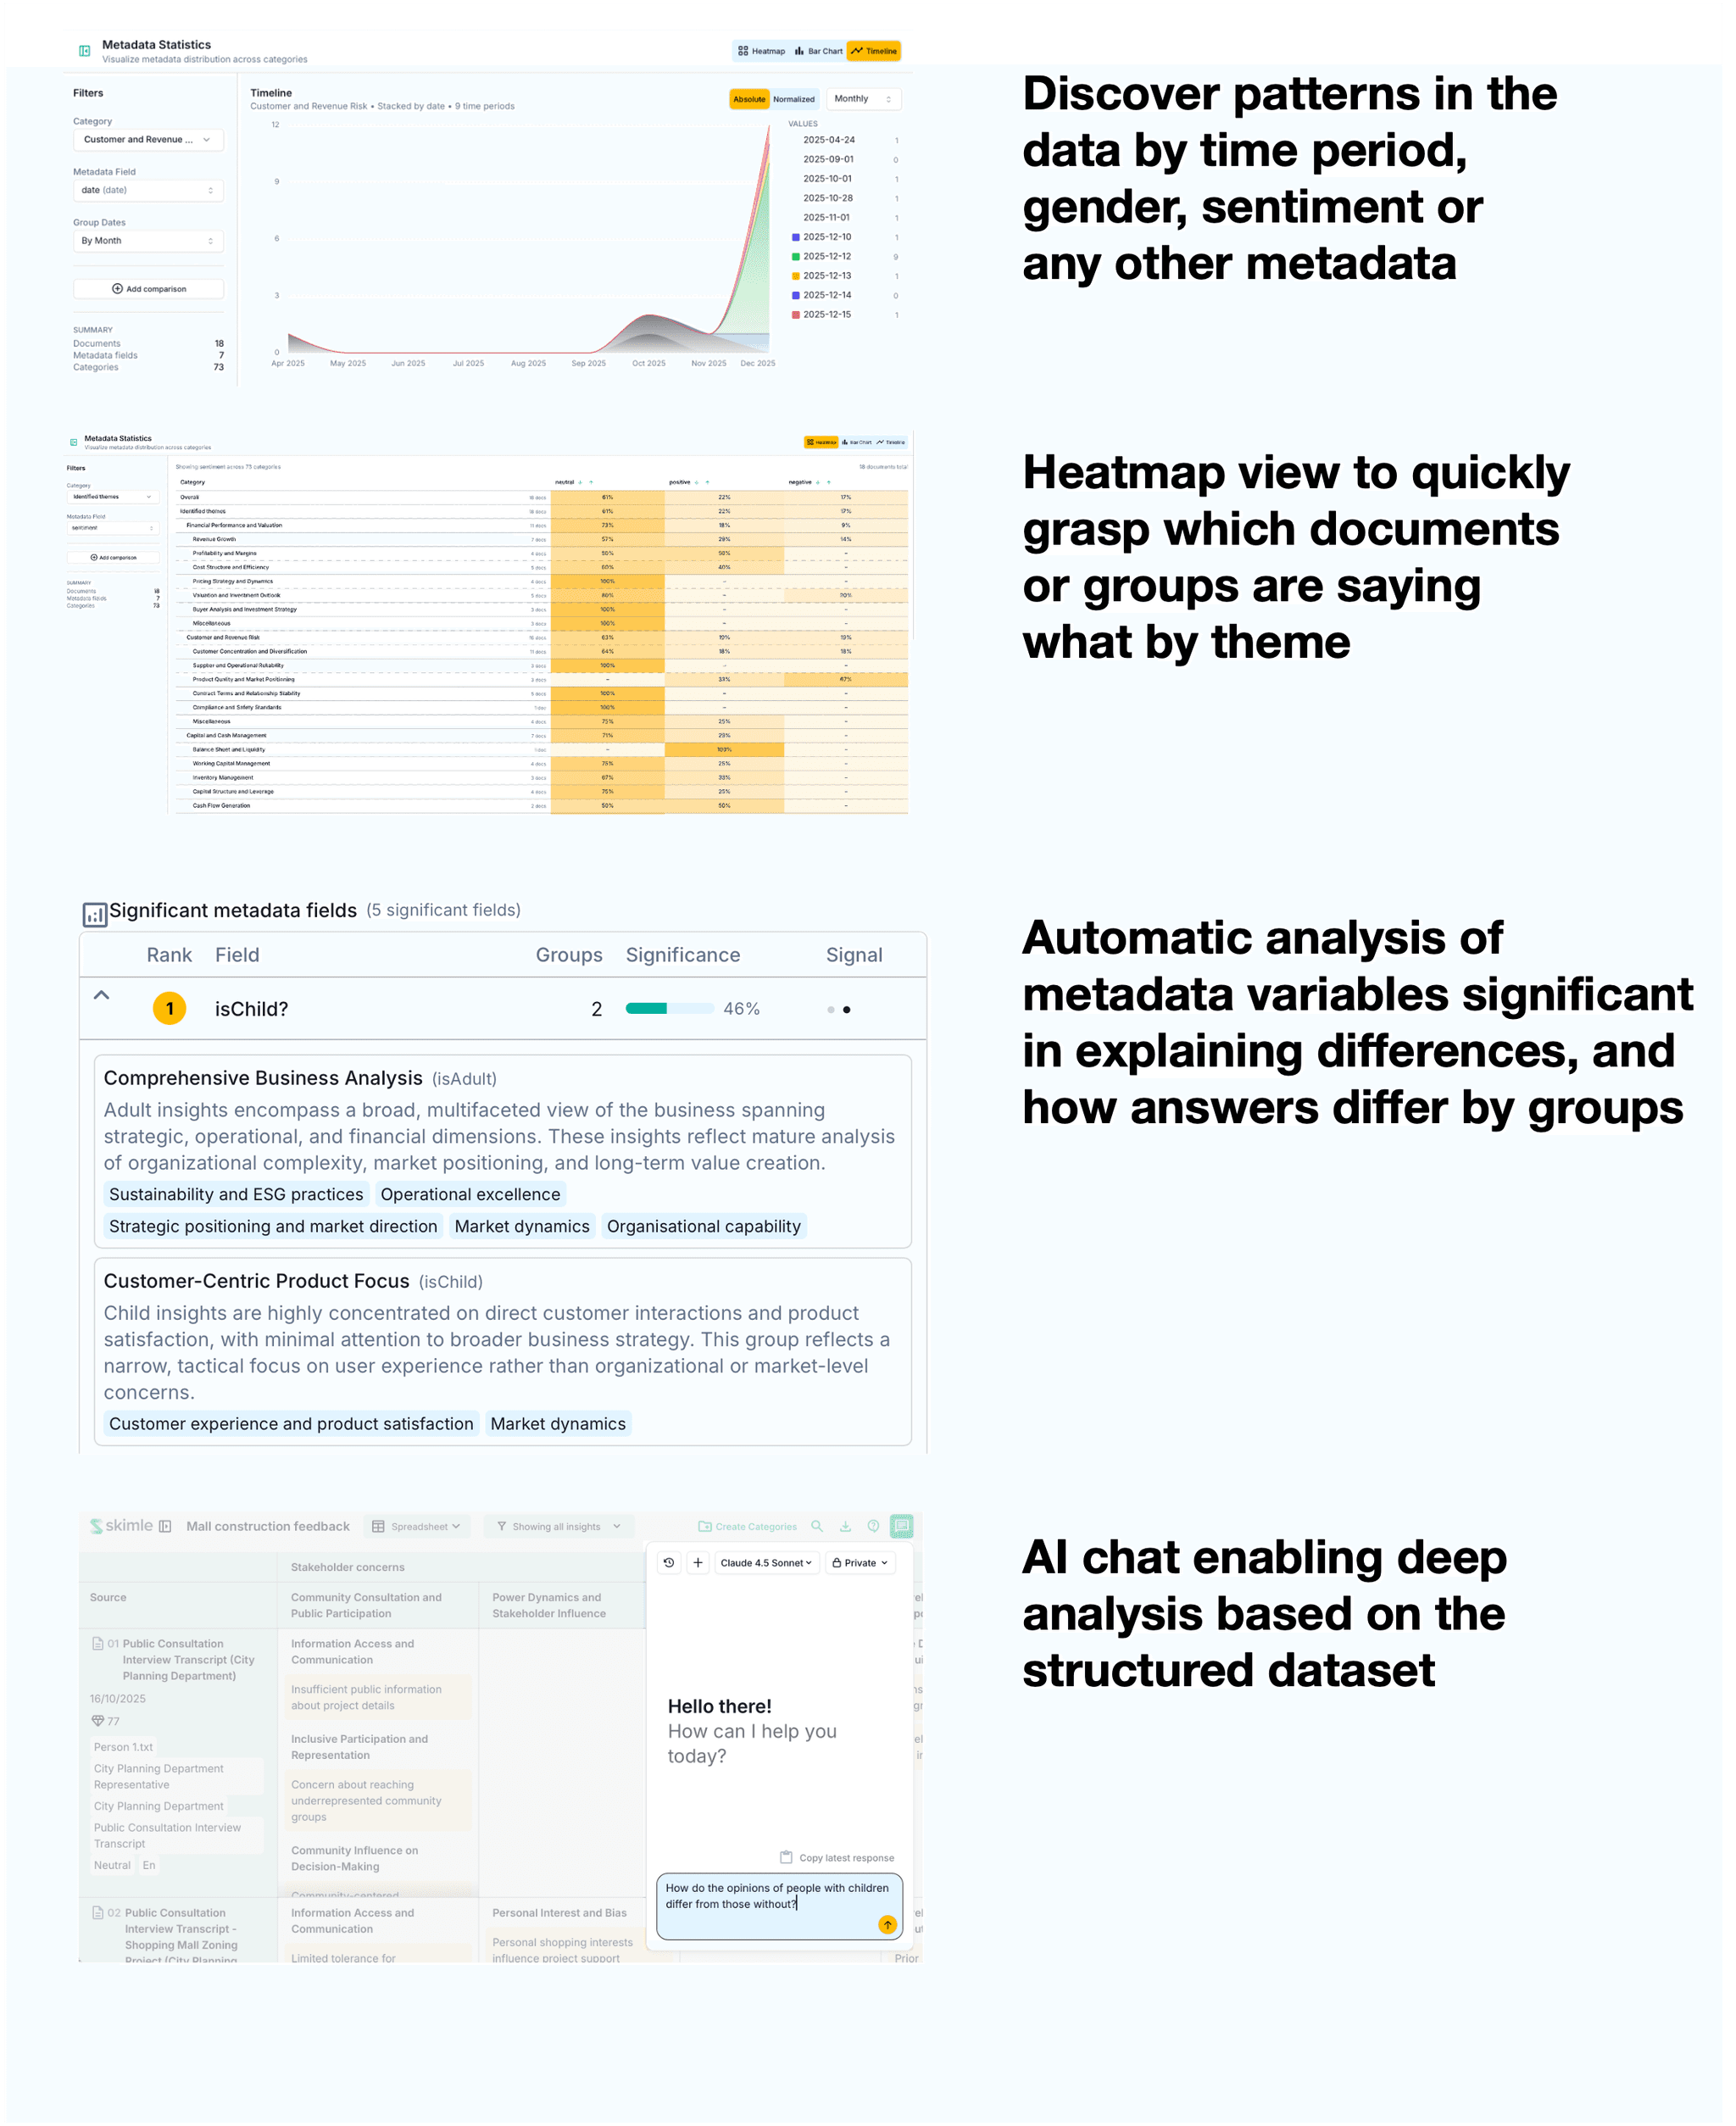
Une liste globale de thèmes ne répond jamais à la question que le métier a réellement posée : qui pense cela, et en quoi cela diffère-t-il selon le segment ? Face à des milliers de verbatims, la plupart des équipes survolent un échantillon et perdent les points de vue minoritaires, qui portent le signal le plus net. Skimle code chaque réponse et vous laisse découper la même structure thématique selon n'importe quelle variable de métadonnées — tranche de NPS, niveau d'offre, marché ou profil — transformant les questions ouvertes d'un baromètre en une lecture en méthodes mixtes sur laquelle agir.
Comment ça marche
- 1. Importez les réponses avec leurs métadonnées
Importez les réponses ouvertes en CSV depuis SurveyMonkey, Typeform ou Qualtrics, avec les colonnes de métadonnées des répondants, pour que chaque réponse porte son segment.
- 2. Construisez la structure de thèmes complète
Skimle code chaque réponse dans une hiérarchie de thèmes, pas seulement les plus fréquents, afin que les points de vue minoritaires restent visibles.
- 3. Segmentez selon n'importe quelle variable
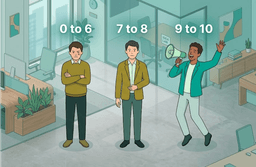
Filtrez et comparez les thèmes par tranche de NPS, niveau d'offre, zone géographique ou profil, pour voir quels sujets comptent le plus pour quels clients.
- 4. Vérifiez les preuves
Chaque tendance remonte à des citations textuelles, de sorte qu'un écart entre deux segments s'appuie sur les réponses exactes qui l'ont produit.
- 5. Exportez un livrable prêt pour le client
Générez un rapport thématique avec citations textuelles et tris croisés, en quelques minutes plutôt qu'en plusieurs jours.


UNE SEULE STRUCTURE DE CATÉGORIES POUR TOUTES LES SOURCES
Réunir chaque canal de retour dans une seule vision du client
Entretiens, verbatims NPS, tickets d'assistance, avis, enregistrements d'appels commerciaux, débriefs gagné-perdu, fils de discussion communautaires, rapports d'analystes et de concurrents. Chaque canal a d'ordinaire son analyse, sa présentation et son vocabulaire propres : rien ne s'additionne, et le même problème client est rapporté trois fois sous trois noms. Skimle code chaque source dans une structure de catégories unique, au sein d'un même projet, puis montre comment chaque canal pondère le même thème. Les instituts s'en servent pour intégrer recherche documentaire et matériaux secondaires à une étude primaire. Les équipes internes s'en servent pour maintenir une vision permanente du client.
Comment ça marche
- 1. Rassemblez les canaux dans un projet
Importez transcriptions, exports CSV, PDF et enregistrements côte à côte. Exports de tickets, extractions d'avis, rapports d'analystes et audio d'entretiens deviennent tous des documents du même projet.
- 2. Étiquetez chaque document avec son canal
Canal, segment, marché et date entrent comme métadonnées : toute comparaison ultérieure entre sources devient un filtre plutôt qu'une nouvelle analyse.
- 3. Codez le tout dans une seule structure
Skimle construit une structure thématique unique sur toutes les sources, ou applique le cadre selon lequel vous rapportez déjà, pour qu'un constat signifie la même chose dans chaque canal.
- 4. Comparez ce que dit chaque canal
Voyez où les sources concordent et où elles se contredisent. Un thème bruyant dans les tickets et absent des entretiens est un constat, pas un écart à faire disparaître.
- 5. Ajoutez la vague suivante sans repartir de zéro
Les données du trimestre suivant sont codées dans la même structure : le baromètre conserve sa comparabilité et le rapport actualisé devient un nouvel export plutôt qu'une reconstruction.


FAQ
Questions fréquentes
Ce sont les questions que les équipes de connaissance client et les responsables d'études en institut nous posent le plus souvent, y compris celles qui sortent directement d'un appel d'offres. Notre grille d'appel d'offres neutre pose les mêmes questions à chaque prestataire que vous évaluez, nous compris.
- En quoi cela nous aide-t-il à rivaliser avec des offres bon marché et superficielles ?
- Les acteurs à bas prix et les habillages d'IA sommaires se battent sur le tarif, avec des nuages de mots et une liste de thèmes à plat. Skimle apporte la profondeur à leur vitesse : un institut se différencie par la qualité du « et alors ? » plutôt que par son tarif journalier, et une équipe interne sort davantage d'études à budget constant. Les heures d'analyste passent du codage mécanique à l'interprétation, la seule partie que quiconque paie réellement. Voyez où part vraiment l'argent d'une étude qualitative →
- Que répondre quand un client ou une partie prenante conteste l'analyse assistée par IA ?
- Décrivez-la exactement : l'IA fait la catégorisation mécanique, une chercheuse ou un chercheur nommément identifié relit chaque thème et rédige l'interprétation. Montrez ensuite les preuves. Chaque affirmation d'un rapport Skimle ouvre sur la citation textuelle et le document dont elle provient — une réponse plus solide que ce que peut offrir une synthèse manuelle, où la logique de codage n'a jamais existé que dans la tête de quelqu'un. 7 règles pour un usage responsable de l'IA dans les études qualitatives →
- Skimle analyse-t-il l'ensemble des données ou un échantillon ?
- L'ensemble. La question mérite d'être posée à chaque prestataire, car plusieurs outils récupèrent un sous-ensemble de vos documents via une recherche par embeddings, l'analysent, et n'indiquent jamais quels documents ont été laissés de côté. Le résultat se lit comme s'il couvrait tout le corpus, ce qui n'est pas le cas. Skimle code chaque document, et vous pouvez en ouvrir n'importe lequel pour voir exactement quels passages ont été codés et lesquels ne l'ont pas été.
- Pouvons-nous appliquer notre propre grille de codage, ou seulement accepter ce que produit l'IA ?
- L'un ou l'autre, et les deux sur le même corpus. Apportez une grille existante et Skimle code de façon déductive à partir d'elle, ou laissez-le construire la structure de façon inductive à partir des données. Les catégories se fusionnent, se scindent, se renomment, se réordonnent et se suppriment ensuite, et l'analyse suit vos modifications. Les instituts qui font tourner un baromètre ou un cadre client d'année en année travaillent généralement en déductif ; les études exploratoires commencent généralement dans l'autre sens.
- Qu'est-ce qui empêche une citation fabriquée d'arriver dans notre rapport ?
- Chaque citation est vérifiée automatiquement par rapport au document source. Si le modèle produit un texte qui n'existe pas mot pour mot dans vos données, Skimle le signale et relance le traitement plutôt que de l'afficher : une citation inventée n'atteint donc pas une présentation client. Vous pouvez aussi ouvrir n'importe quel document et voir quels passages ont été codés et lesquels ne l'ont pas été — c'est ainsi qu'on rattrape l'erreur inverse, celle d'un oubli. Comment fonctionne la transparence bidirectionnelle →
- Comment évaluer Skimle face aux autres outils de notre liste ?
- Faites un pilote plutôt que de regarder des démonstrations. Prenez un corpus que vous avez déjà analysé, pour connaître la bonne réponse ; écrivez trois tâches avant de commencer (un codage, une comparaison de segments, une recherche de preuves) ; chronométrez chacune, travail de correction compris ; et contredisez délibérément l'outil pour voir à quelle vitesse vous pouvez restructurer sa production. Nous menons volontiers un projet réel en parallèle de votre outil actuel, et la formule gratuite permet à une personne de se faire un avis en une après-midi avant même cela. La grille d'appel d'offres en 7 domaines et son modèle de notation →
- Quel volume Skimle peut-il traiter, et dans combien de langues ?
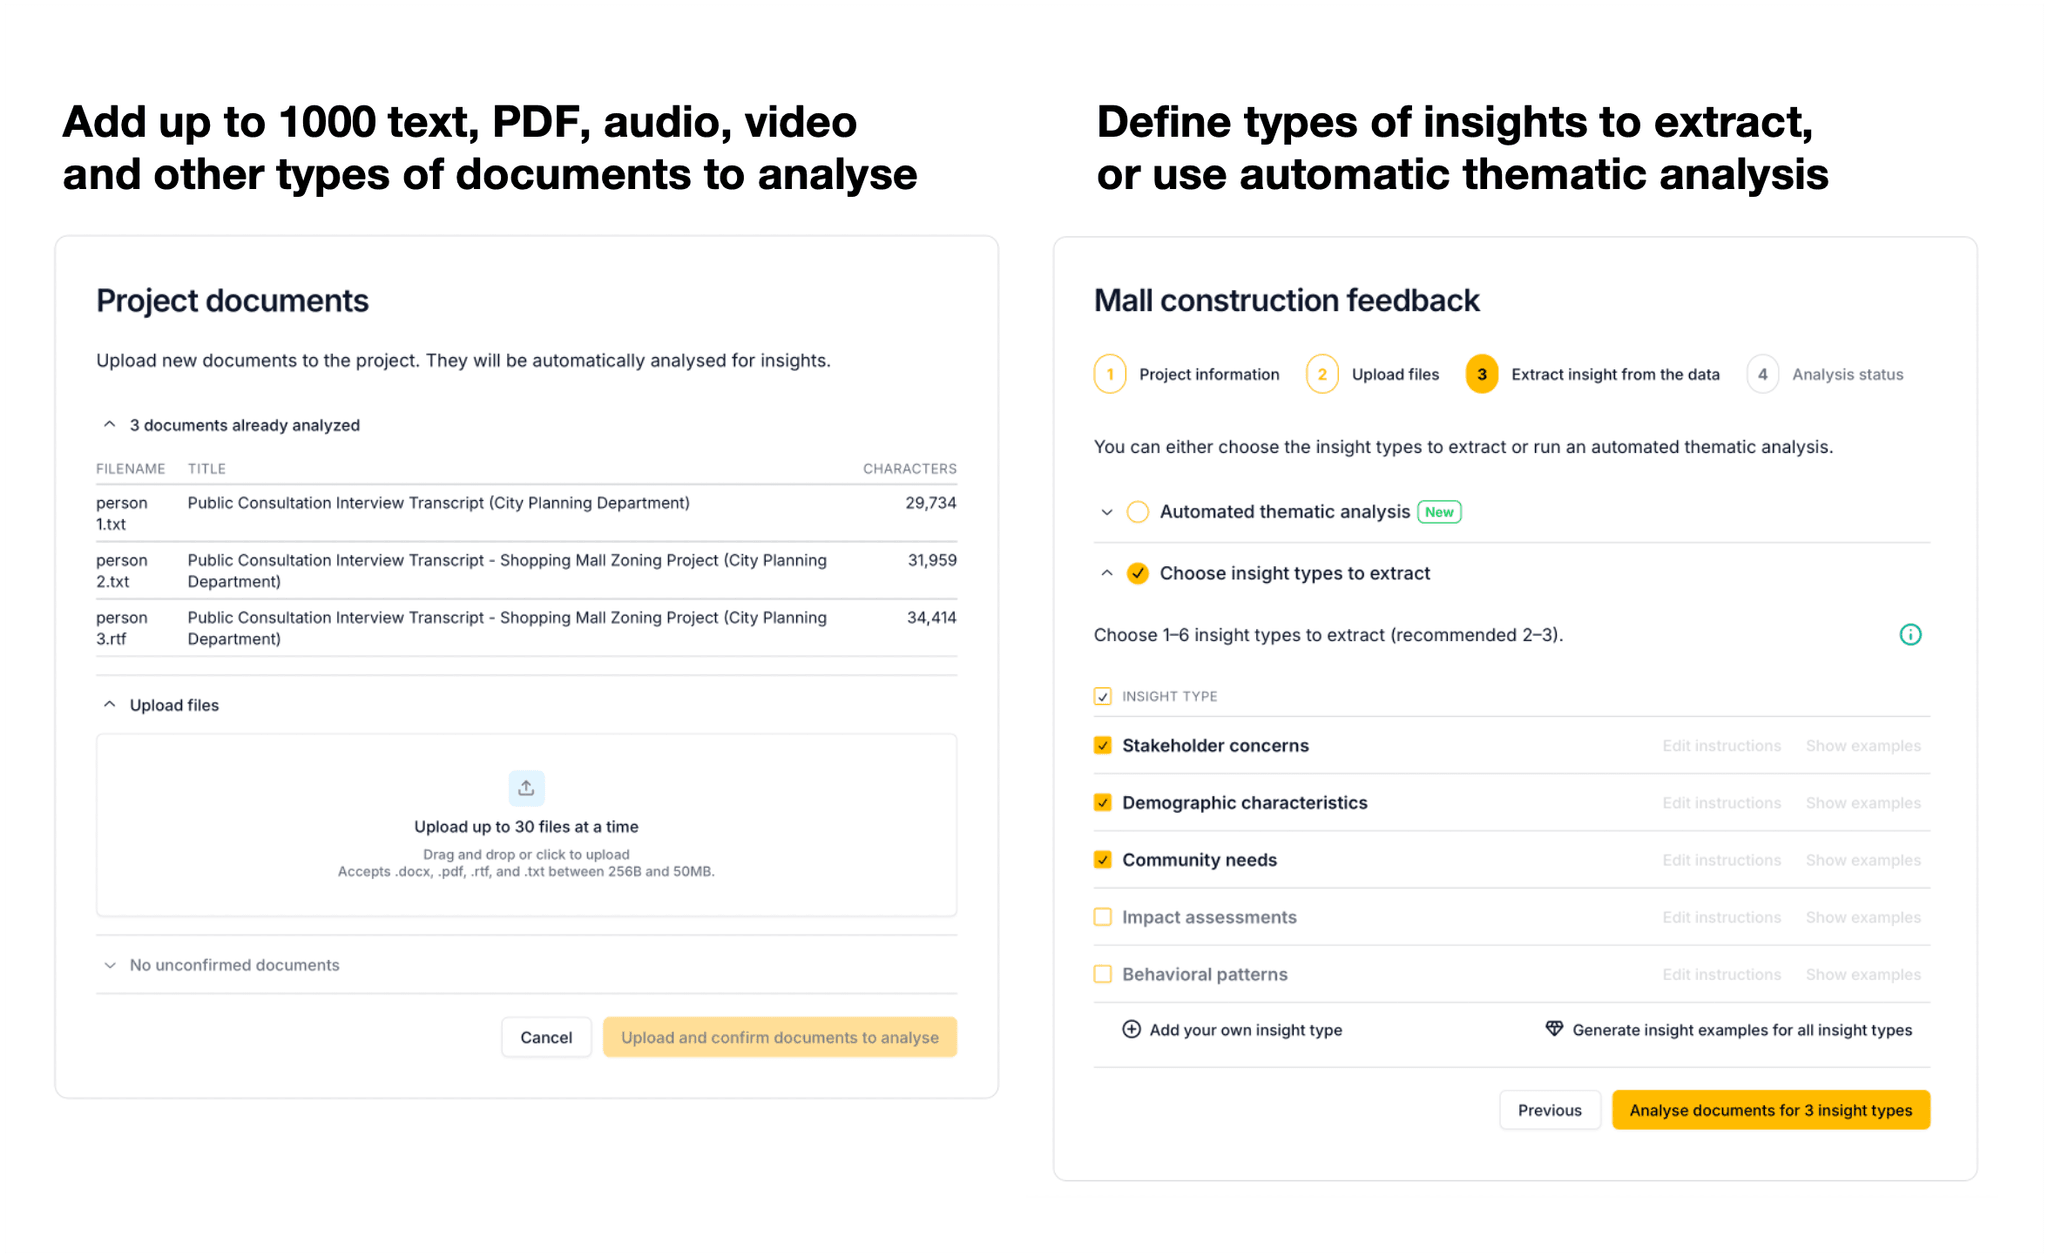
- Jusqu'à 1 000 documents par projet, ce qui couvre aussi bien une étude de 20 entretiens qu'un baromètre mondial de plusieurs milliers de réponses, et plus de 100 langues analysées dans leur langue d'origine, sans étape de traduction. Un même projet peut mêler anglais, espagnol, mandarin, allemand et arabe, construire une structure thématique sur l'ensemble et conserver chaque citation dans sa langue d'origine. Si vous travaillez régulièrement en haut de cette fourchette, parlons d'un accord sur les volumes.
- Les données clients sont-elles sécurisées et confidentielles ?
- Toutes les données sont hébergées et traitées au sein de l'UE sur AWS, dans un environnement configuré par un tiers certifié, et les données clients ne servent jamais à entraîner des modèles. Des accords de sous-traitance sont disponibles, nous travaillons sous accords de confidentialité clients, la pseudonymisation est intégrée au flux de travail, et un déploiement en cloud mono-locataire ou en cloud privé est possible là où la souveraineté des données l'exige.
- Qu'advient-il de notre analyse si nous cessons d'utiliser Skimle ?
- Vous l'emportez, quelle que soit la formule. Exportez les données codées au format ouvert REFI-QDA (.qdpx) et poursuivez dans NVivo, ATLAS.ti ou MAXQDA, ou emportez des sorties Word, PowerPoint et Excel avec les citations rangées par thème. Nous mettons en œuvre la norme d'interopérabilité précisément pour que rester soit un choix et non une conséquence.
- Comment fonctionne la tarification quand notre volume d'études varie ?
- Skimle est un abonnement léger par utilisateur, avec une dotation de crédits incluse, complété par des packs de crédits achetés pour les mois où tourne une grosse étude. L'abonnement garde toute l'équipe dans l'outil entre les projets ; les packs rattachent le coût au projet qui l'a causé, ce qui compte pour les instituts qui le refacturent. Les parties prenantes qui ont seulement besoin de lire les résultats n'ont pas besoin d'un poste : les exports et les rapports imprimables y suffisent.
- Plusieurs chercheurs peuvent-ils travailler sur le même projet ?
- Oui, simultanément, les modifications et annotations de chacun étant conservées. Cela convient à la relecture par les pairs et au contrôle qualité, et cela convient au partage d'une grande étude entre chercheurs juniors et seniors, une personne senior pilotant la structure de catégories.
À propos de Skimle
Conçu par des professionnels, pour des professionnels
Skimle est basé en Finlande et construit par des personnes qui ont passé leur carrière à faire de l'analyse qualitative sous une vraie pression professionnelle. Nous l'avons construit parce que nous en avions besoin, et parce que les outils existants étaient trop lents, trop superficiels ou trop opaques pour être défendus devant un client.
Nous avons la confiance d'instituts d'études, d'agences, de ministères finlandais, de plus de 30 universités et de grandes entreprises. Toutes les données sont hébergées dans l'UE et traitées conformément à notre politique RGPD stricte et à nos conditions d'utilisation.
Si votre institut ou votre fonction connaissance client s'intéresse aux solutions en marque blanche, aux licences entreprise, aux tarifs par volume ou aux accords de revente, contactez-nous. Les accords à l'échelle du cabinet comme les déploiements sur mesure sont envisageables.