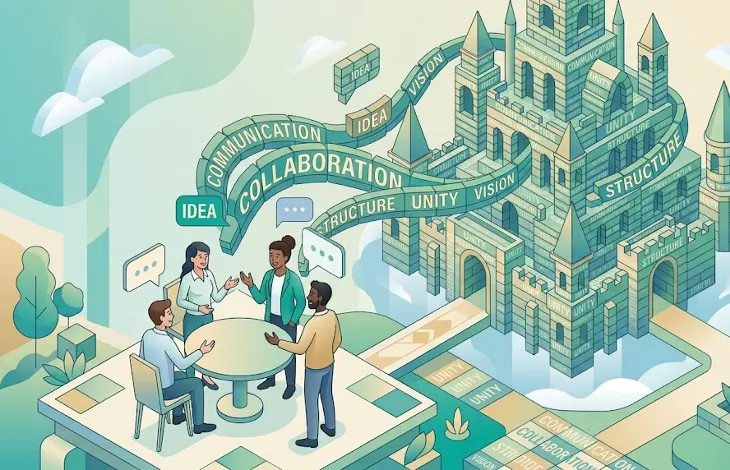
Reflexive thematic analysis follows 6 phases: familiarise yourself with the data, generate initial codes, construct themes, review and develop themes, refine and define themes, then write the analysis. Each phase is interpretive and iterative, shaped by the researcher's own position. Skimle can assist at phases 3 to 5 by surfacing candidate patterns, while leaving the interpretive decisions with you.
If you want the philosophical underpinning of why this approach exists and how it differs from the 2006 version, read the companion guide on reflexive thematic analysis and Braun and Clarke's updated approach first. This post is more practical: it walks through all 6 phases with a concrete worked example, shows what decisions a researcher actually makes at each stage, and includes real coding choices and reflexivity journal entries along the way.
For a broader orientation to qualitative methods, thematic analysis in qualitative research provides helpful context on how RTA fits within the wider landscape.
The six phases below follow Braun and Clarke's framework. Cite the 2006 paper for the phase structure itself, and the 2019 or 2021 papers when you describe your analysis as reflexive.
The worked example: 10 interviews about switching software
Throughout this post, we use a single fictional but realistic dataset: ten semi-structured interviews with professionals who recently switched from one project management software to another. The research question is: What drives the decision to switch project management software, and how do users make sense of that decision in retrospect?
The dataset is small enough to follow in detail and large enough to illustrate genuine analytical complexity. Our researcher, call her Mia, is a PhD student in organisational behaviour with a background in UX consulting. That background matters and will appear in the reflexivity notes.
Sample size note: ten interviews is appropriate for a focused study with a specific research question, though it sits at the lower end of what is typical for RTA. Braun and Clarke do not set a fixed minimum; the question is whether the dataset is rich enough to support the analysis. Our guide on how many interviews qualitative research and qualitative research sample size cover this reasoning in depth.
Phase 1: Familiarisation with the data
What happens at this phase?
Familiarisation means reading and re-reading your data until you know it thoroughly. For interview data, this typically involves reading transcripts multiple times, sometimes while listening to recordings, and writing your first analytical notes. Braun and Clarke are clear that this is not passive reading: you are already interpreting, noticing things, forming hunches. The goal is to move from "what did people say?" to "what is happening in this data?"
At this phase you are not yet coding. You are building the kind of intimate knowledge of the dataset that makes later coding genuinely interpretive rather than mechanical.
What does Mia do?
Mia reads each transcript twice. The first read is for comprehension: she gets a feel for each participant's situation, vocabulary, and tone. The second read is active: she writes notes in the margin and in a separate analytic journal.
Her journal entry after the third transcript reads:
"Three transcripts in and I keep noticing the word 'frustration', but it's not always the old software being frustrating. Sometimes it's the decision process itself that frustrated them. P2 said the IT team's approval timeline made her feel invisible. That reads less like a feature complaint and more like something about agency and voice inside the organisation. Am I tuning into this because of my UX background? Probably. Worth watching."
This is reflexivity in action. Mia notices that her professional history as a UX consultant makes her sensitive to themes about agency and design. She does not try to suppress this; she flags it so she can return to it.
Practical output from Phase 1: a set of notes per transcript, plus initial analytic journal entries that capture hunches, questions, and emerging points of interest. These are not codes yet. They are the raw material that will inform coding.
A common mistake at this phase is to skip it and go straight to coding, especially when working with large datasets. Resist this. Researchers who skip familiarisation tend to produce thin, descriptive codes because they are reacting to the data line-by-line rather than working from a whole-dataset sense of what matters.
Phase 2: Generating initial codes
What happens at this phase?
Coding in reflexive TA is not labelling. It is the researcher's interpretive response to each unit of data. A code captures something interesting about an excerpt in relation to the research question. The same excerpt can receive multiple codes. Codes can be short phrases or full sentences; they can be close to the participant's own language (in vivo) or more analytical.
Braun and Clarke distinguish reflexive TA coding from the kind seen in content analysis, where you are counting occurrences of predefined categories. In RTA, codes are provisional observations about meaning, not tallies. You can read more about the different forms coding can take in our guides on how to code qualitative data and qualitative coding more broadly.
At this phase you code across the entire dataset, generating as many codes as seem meaningful. Quantity is not the goal, but you should err on the side of coding too much rather than too little. Consolidation comes later.
What does Mia code?
Here is a short excerpt from Participant 4's transcript, followed by the codes Mia assigns:
"I'd been thinking about switching for almost a year, but I never actually did anything about it. It took my manager going on parental leave and me suddenly having to run everything myself. Then I just did it in a weekend. I'm not sure if I was waiting for permission or waiting for an emergency."
Mia's codes for this excerpt:
- Permission-seeking before action (the participant frames the switch as something requiring external authorisation)
- Crisis as catalyst (the disruption of routine, not accumulated frustration, triggered the switch)
- Retrospective uncertainty about motivation (the participant is genuinely unsure of their own reasons in hindsight)
- Autonomy unlocked by absence of authority (the manager's leave removed a constraint rather than adding capability)
Notice that none of these codes are simple topic labels like "decision-making" or "timing." They are interpretive observations. The code "autonomy unlocked by absence of authority" goes well beyond what the participant literally said; it captures Mia's interpretation of the dynamic she observes.
Her journal at this point:
"I coded P4's 'I'm not sure if I was waiting for permission or waiting for an emergency' four ways. That's unusual for me, since I usually try to pin down the one right reading. But the excerpt is genuinely ambiguous and the ambiguity feels analytically important. Keep both the permission and the autonomy codes. Don't force resolution yet."
After coding all ten transcripts, Mia has approximately 180 distinct codes. Some appear across multiple transcripts; others appear once and may not survive into themes.
Practical output from Phase 2: a full set of codes with accompanying data extracts, organised in a way that lets you see where each code appears. Many researchers use a spreadsheet, a qualitative analysis tool, or annotated transcripts. The key requirement is that you can move from any code back to its source data.
Phase 3: Constructing themes
What happens at this phase?
Themes are not big codes. They are patterns of shared meaning across the dataset that are relevant to the research question. At Phase 3 you begin grouping codes together into provisional themes, creating what Braun and Clarke call a thematic map.
This is the phase where the distinctively interpretive work of RTA becomes most visible. You are not grouping codes that cover the same topic; you are identifying codes that together constitute a pattern of meaning at a higher level of abstraction.
A thematic map is a visual or diagrammatic representation of how codes relate to potential themes, and how themes might relate to each other. It is a working document, not a final product.
How does Skimle assist here?
This is where a tool like Skimle's automatic thematic analysis can reduce cognitive load. Skimle can surface clusters of semantically related excerpts across a corpus, which helps a researcher see candidate groupings that might otherwise take hours to construct manually. Importantly, the tool does not decide what your themes are. It shows you which pieces of data are pulling together, and you decide what that clustering means and whether it constitutes a genuine pattern of meaning.
In practice, Mia uses Skimle to run an inductive analysis across her ten transcripts. The tool identifies several clusters. One clusters around excerpts involving institutional constraints (approval processes, IT gatekeeping, procurement timelines). Another clusters around emotional language tied to a sense of wasted time. A third clusters around retrospective reframing, where participants describe the switch as "obvious in hindsight" even though they had resisted it for months.
Mia treats these clusters as provocations, not conclusions. She reviews every excerpt in each cluster herself, asks whether the pattern makes analytical sense, and begins drafting theme descriptions.
Her initial thematic map has six candidate themes:
- Institutional inertia: the gap between dissatisfaction and action
- Crisis as the permission nobody asked for
- Retrospective sense-making: rewriting the past
- The social cost of switching (colleagues, workflows, norms)
- Feature expectations vs actual usage
- Identity stakes: being the person who pushed for change
Practical output from Phase 3: a thematic map (drawn or diagrammatic) and brief written descriptions of each candidate theme. These descriptions should say something about what the theme means, not just what it covers.
Phase 4: Reviewing and developing themes
What happens at this phase?
Phase 4 is where you test your candidate themes against the data. Braun and Clarke describe a two-level review: first, check that the excerpts within each candidate theme genuinely cohere (they really do share a pattern of meaning); second, check that each theme is distinct from the others (themes should not substantially overlap).
You will almost certainly merge, split, drop, or rename themes at this phase. That is not a sign of failure; it is the work.
What does Mia find?
Reviewing her six candidate themes, Mia makes several changes.
Themes 1 and 2 merge. After reading back through all the excerpts in "institutional inertia" and "crisis as permission," she realises they are both really about the same underlying pattern: the switch happened not when dissatisfaction peaked, but when an external event removed or overrode the usual constraints. The two themes describe the same dynamic from different angles. She merges them into: "The gap between dissatisfaction and action: how switches wait for permission."
Theme 5 becomes a subtheme. "Feature expectations vs actual usage" has data, but it does not have the analytical weight of a standalone theme. It is really a facet of retrospective sense-making. Participants who talked about features in the past tense were doing the same rewriting-the-past work as participants who talked about emotional experience. She folds it into Theme 3.
Theme 6 survives but is renamed. "Identity stakes" was a working label she has grown uncertain about. Reading back through the excerpts, what strikes her is less about identity per se and more about accountability: participants who had championed the switch to colleagues felt more invested in it working out, regardless of personal identity. She renames it: "Championing the switch: accountability and investment in the outcome."
Her journal at this point:
"Dropping Theme 5 was hard. I have good data there. But it doesn't stand on its own. It's an example of the retrospective sense-making pattern, not a separate thing. I notice I want to keep it because I spent time on it. That's not a reason. Remove it."
After Phase 4, Mia has four themes, down from six. This is normal. Over-splitting is a common early phase tendency; consolidation is part of the work.
Practical output from Phase 4: a revised thematic map, updated theme descriptions, and a clear account (in your journal or notes) of why changes were made.
Phase 5: Refining, defining, and naming themes
What happens at this phase?
This is the most intellectually demanding phase. For each surviving theme, you now write a detailed analytic account that:
- Defines the essence of the theme (what pattern of meaning it represents)
- Explains how the theme answers or relates to the research question
- Identifies the range of variation within the theme (not all excerpts will express the theme identically)
- Selects 2-4 exemplary quotes that will anchor the written-up theme
The theme name produced at this phase should be an analytical claim, not a topic label. "Decision timing" is a topic. "Waiting for permission that never comes: dissatisfaction as a necessary but insufficient trigger" is a theme name that tells you something about what the researcher found.
Mia's theme definitions
Here is one of Mia's completed theme definitions at Phase 5:
Theme: "The switch waited for permission, not readiness"
Definition: Across the dataset, dissatisfaction with the old software was a near-universal condition: participants had been frustrated for months or years before switching. But dissatisfaction alone did not trigger the switch. The switch happened when an external event (a manager's absence, a project failure, a team restructure, an IT policy change) removed or overrode the usual constraints on changing tools. Participants framed these events as "finally" or "at last," which reveals retrospectively that they had been ready but waiting for external authorisation. The theme speaks to the institutional embeddedness of even personal software decisions: individual readiness is insufficient without structural conditions that make switching permissible.
Variation: Some participants had a single clear trigger event; others described an accumulation of small external shifts. A small number described making the switch unilaterally without any external trigger, but significantly, all of these participants held authority positions (team leads, solo founders) where they did not need permission from others.
Central quotes: P4 ("I'm not sure if I was waiting for permission or waiting for an emergency"), P7 ("When the IT block expired I just did it that day, even though nothing else had changed"), P1 ("My manager would never have approved this, so I waited until she moved teams.")
Practical output from Phase 5: full written definitions for each theme, a finalised set of theme names, and the selected quotes for each. This document is the foundation of your results section.
Phase 6: Writing the analysis
What happens at this phase?
The write-up is not a report of what you found. It is the final analytical act. In reflexive TA, the written account is where themes are argued, not merely described. You weave together data extracts, your interpretation, and your theoretical lens into a coherent narrative about what the data means in relation to your research question.
Braun and Clarke are insistent on this: themes are not illustrated by quotes, they are argued through them. The difference matters. Describing a theme and then stacking quotes underneath it produces what they call a "thematic description" (a summary of what people said). Arguing through quotes means that each extract is doing analytical work, each one supported by your interpretive commentary.
What does a well-written theme section look like?
Here is a shortened example from Mia's results section for her first theme:
The most consistent pattern across the dataset was not that participants decided to switch, but that they stopped waiting. Dissatisfaction with existing software was near-universal and long-standing; the trigger for action was almost always external.
Participant 4 captured this most clearly: "I'm not sure if I was waiting for permission or waiting for an emergency." This retrospective uncertainty (was it permission or crisis?) is analytically significant. It suggests that participants themselves could not cleanly distinguish between needing external authorisation and needing an external forcing function. Both amount to the same thing: individual readiness was not sufficient.
The participants who made the switch without an obvious trigger were all in positions of organisational authority. Participant 9, a sole founder, noted simply: "I just switched. Nobody stops me from doing that." The ease with which she describes this underlines what is absent in most other accounts: the structural freedom to act on dissatisfaction without institutional permission.
For full guidance on structuring the write-up, including the methods section, results section, and how to handle quotes, see our guides on how to write thematic analysis and how to write a thematic analysis results section with structure and examples.
What the 6 phases look like as a whole
It is worth stepping back to see the full arc of the process. The table below summarises what happens at each phase and the key output.
| Phase | Core activity | Key output | Common mistake |
|---|---|---|---|
| 1. Familiarisation | Deep reading; analytic notes | Notes and journal entries | Skipping this and jumping straight to coding |
| 2. Coding | Interpretive labelling across full dataset | ~100-200+ initial codes | Coding as topic-labelling rather than interpretation |
| 3. Constructing themes | Grouping codes into candidate themes | Thematic map (draft) | Treating every code cluster as a theme |
| 4. Reviewing themes | Testing themes against data; merging, splitting, dropping | Revised thematic map | Keeping themes because you spent time on them |
| 5. Defining themes | Writing full theme definitions and names | Theme definitions + quote selection | Naming themes as topics, not analytical claims |
| 6. Writing up | Arguing themes through data in the analysis text | Results section draft | Describing themes rather than arguing through them |
The phases are iterative. Mia returned to Phase 2 (re-coding some excerpts) after her Phase 4 review revealed that some codes did not fit where she had placed them. That is not a failure of process; it is how reflexive TA works.
How to keep a reflexivity journal throughout the process
A reflexivity journal is not optional in reflexive TA; it is the record of your interpretive process. It serves three purposes: it develops your thinking as you write, it creates an audit trail of your analytical decisions, and it generates the reflexive material you will need for your methods section and, sometimes, your results section.
What should go in the journal? Anything that captures your analytical process:
- Why you coded something one way and not another
- Where you felt uncertain or surprised
- When you changed your mind and why
- Moments where your own background, assumptions, or theoretical commitments were clearly shaping what you were noticing
- Decisions about theme construction: why you merged, split, or dropped a theme
The journal does not need to be long. Three to five lines after each coding session is enough to build a meaningful record. What matters is that it is specific and candid: not "coding went well today" but "I resisted coding P3's excerpt as permission-seeking because she used confident language, but the content says the same thing as P4. Coded it. Note the gap between tone and content."
For a deeper account of what reflexivity involves and how to write a positionality statement, see our guide on reflexivity in qualitative research.
How does Skimle support reflexive thematic analysis?
Skimle is designed for researchers who want the speed of AI-assisted analysis without giving up interpretive control. This is precisely the tension that arises when PhD students try to use general-purpose tools for RTA.
At Phases 3 to 5, Skimle helps by:
- Surfacing candidate patterns across all your transcripts simultaneously, so you can see which excerpts cluster around emerging themes rather than discovering them transcript-by-transcript
- Keeping every insight traceable to the specific excerpt it derives from, so you can interrogate any AI-generated pattern against your own reading of the data
- Supporting iterative revision: you can reorganise themes, rename categories, and re-run analysis as your thematic map evolves
Skimle does not generate theme names or write your analysis. Those are irreducibly interpretive acts that belong to you. What it does is reduce the procedural cognitive load so that your interpretive energy goes where it is most needed.
If you work in academic research, see how Skimle fits into a rigorous qualitative workflow. The automatic thematic analysis docs and predefined categories docs explain the technical detail of how the analysis works.
Frequently asked questions
How long does reflexive thematic analysis take?
There is no fixed answer, but for a dataset of 10-15 interviews, plan for 40-80 hours of focused analytical work from familiarisation to writing the results section. Coding tends to take longer than researchers expect, and Phase 4 (reviewing themes) is often underestimated. Using a tool like Skimle to assist at Phases 3-5 can reduce the time spent constructing an initial thematic map, but it does not replace the interpretive work of reading, defining, and writing up themes.
Can reflexive thematic analysis be used with data other than interviews?
Yes. RTA applies to any text-based qualitative data: focus group transcripts, open-ended survey responses, fieldnotes, documents, online posts, or any combination. The 6 phases remain the same. The main practical difference is that the density of data per unit varies: a focus group transcript is a single document but represents multiple voices. Our guides on thematic analysis and how to code qualitative data address these variations.
Should I use software for reflexive thematic analysis?
Software helps with organisation and navigation: keeping track of codes, linking excerpts to themes, and maintaining a searchable record of your coding decisions. Whether you use a specialist qualitative analysis tool, Skimle, or a well-structured spreadsheet depends on your budget, institutional context, and dataset size. For datasets of 20 or more interviews, a dedicated tool is strongly advisable. The complete guide to thematic analysis and our overview of qualitative data analysis tools discuss the options.
Do I need to justify my sample size using data saturation?
No. Saturation is a concept from grounded theory's logic of theoretical sampling, and Braun and Clarke are explicit that it does not belong in reflexive TA. Justify your sample size in terms of the depth of data needed to address your research question and your analytical approach. Ten rich interviews with good depth is better evidence for a focused study than thirty shallow ones. See how many interviews for qualitative research for the full reasoning.
How do I cite reflexive thematic analysis correctly in my methods section?
Cite at minimum Braun and Clarke (2006) for the 6-phase structure and Braun and Clarke (2019) or (2021) for the reflexive framing. A standard methods sentence would read: "Data were analysed using reflexive thematic analysis (Braun & Clarke, 2006, 2021), with coding conducted iteratively and themes constructed as interpretive patterns of meaning rather than pre-existing features of the data."
Ready to take your reflexive thematic analysis from transcripts to themes with rigour and speed? Try Skimle for free and see how AI-assisted pattern recognition can support your interpretive process while keeping every insight traceable to its source.
Related reading:
- Reflexive thematic analysis and Braun and Clarke's updated approach: what changed and why
- How to write up a thematic analysis
- How to write a thematic analysis results section
- How to code qualitative data: inductive, deductive, and abductive approaches
- Reflexivity in qualitative research: 3 types and how to practise them
About the author
Olli Salo is a former Partner at McKinsey & Company where he spent 18 years helping clients understand the markets and themselves, develop winning strategies and improve their operating models. He has done over 1000 client interviews and published over 10 articles on McKinsey.com and beyond. LinkedIn profile