Most product teams have a ritual: someone opens App Store Connect on a Monday morning, skims through the one-star reviews from the past week, and pastes the worst ones into a Slack channel. The team winces, someone says "we need to fix that," and then the reviews are forgotten until next Monday. Meanwhile, the Google Play console sits open in another tab with a similar queue of feedback that nobody quite gets to.
This is not really the team's fault. Reading reviews one by one is genuinely time-consuming, and extracting meaningful patterns from hundreds or thousands of individual ratings requires a kind of systematic analysis that spreadsheets and gut instinct were not designed to do. But here is the thing: App Store and Google Play reviews are one of the richest, most underused qualitative datasets in product development. They arrive continuously, come with structured metadata attached, and represent unprompted user sentiment at a volume that most internal research programmes could never match. If you treat them as individual tickets rather than a corpus to be analysed, you are leaving most of the signal on the table.
This post is about what a proper App Store review analysis actually looks like, how to set it up, and what kinds of patterns become visible once you stop reading reviews individually and start treating them as a dataset.
Why app reviews are better data than they look
The typical knock on app reviews is that they are biased toward extremes: people who are furious or delighted, with everyone in the middle staying silent. That is true to some extent. But the same critique applies to NPS surveys, support tickets, and most other feedback channels. The question is not whether the sample is perfect, it is whether the dataset is useful.
A few things make reviews particularly valuable. First, they are unprompted. Nobody from your team coached the user through a structured interview or pre-selected topics for them to comment on. Users are writing about what bothers them most, in their own words, at the moment of peak frustration or delight. That kind of unsolicited feedback often surfaces problems your team did not think to ask about.
Second, every review comes with metadata attached: star rating, date, app version, device OS, and country. This turns what looks like a pile of qualitative text into a structured dataset that can be sliced and compared across dimensions. Version 3.2 might have a different complaint profile than version 3.1. German users might be raising issues that US users are not. One-star reviews from iOS users might be about something completely different from one-star reviews from Android users.
Third, the volume is there. A reasonably successful app accumulates hundreds or thousands of reviews over time. At that scale, individual outlier reviews stop distorting the picture, and genuine patterns become statistically meaningful even without formal hypothesis testing.
Getting the data out
Before you can analyse anything, you need the reviews in a format you can work with.
App Store (Apple): Apple provides review data through App Store Connect. You can export reviews manually as a CSV from the dashboard, or access them programmatically through the App Store Connect API. The API requires a JWT token and is a bit more work to set up, but it is the right approach if you want to pull a large historical archive or automate regular exports. There are also third-party tools (Appbot, AppFollow, Sensor Tower, and similar) that aggregate reviews from both stores and handle the extraction for you.
Google Play: The Play Console allows you to download reviews as a CSV directly from the Reviews section. The export includes the review text, star rating, reply (if any), device, Android version, app version code, and date. Like Apple, Google also has a Play Developer API if you prefer programmatic access.
Either way, you should end up with a CSV or spreadsheet that has at minimum: review text, rating, date, and app version. Country and device data are available in both stores' exports and worth including if you have any reason to think user experience varies by region or platform.
Once you have the data, the question is what to do with it. This is where most teams stall.
Why reading reviews individually does not scale
Reading reviews one by one has an obvious ceiling. Even a disciplined team going through 50 reviews a week will miss patterns that only appear across hundreds of responses. The human mind is pattern-matching across perhaps 20-30 items in working memory, not 500.
There is also a cognitive bias problem. The most recent reviews are weighted disproportionately. Vivid, emotional language sticks in memory more than neutral descriptions of the same problem. If three users in a row mention a specific bug, that bug feels universal even if it only affects 2% of your user base. Conversely, a low-frequency but high-severity problem mentioned in dry, technical language can easily be overlooked.
These are not failures of attention or discipline. They are structural limitations of reading-based analysis. The solution is to treat the reviews as a corpus that needs to be coded and categorised systematically, the same way a researcher would treat interview transcripts or open-ended survey responses.
If you have done thematic analysis on qualitative data before, the approach is familiar. You are looking for recurring themes, grouping related observations, and then measuring how those themes distribute across your metadata dimensions. If you have not worked with qualitative analysis at this level, the guide on analysing open text responses at scale covers the fundamentals in a practical way.
What good analysis reveals
Here is the kind of insight that becomes accessible once you move beyond individual review reading:
Feature-specific complaints by version
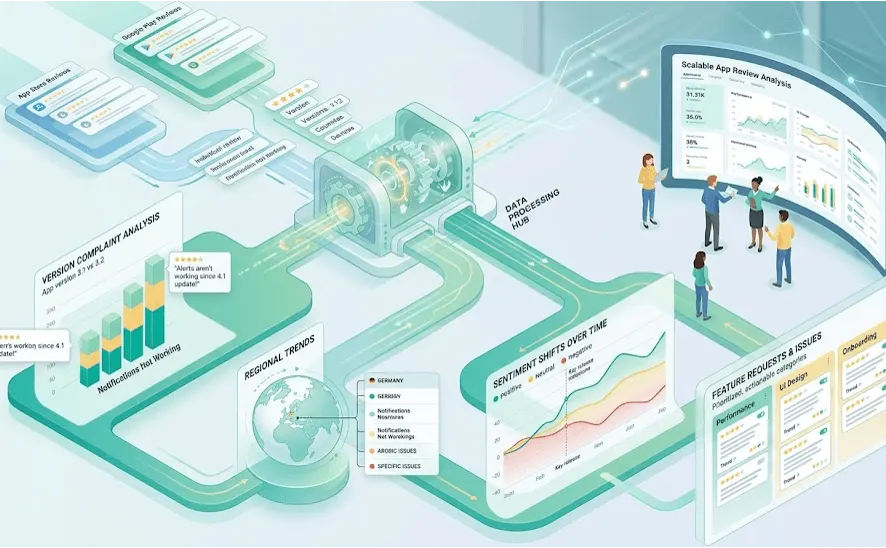
When you code reviews by theme and cross-reference against app version, you can see exactly when a problem started. If reviews mentioning "notifications not working" jump from 3% of all reviews to 18% after version 4.1 ships, that is a clear signal pointing to a specific release. Without version-based analysis, that pattern is invisible in the noise of general feedback.
This kind of version-specific breakdown is particularly useful for post-release monitoring. Rather than watching overall star rating (which moves slowly and blends multiple issues together), you can watch the thematic composition of new reviews to see whether a release introduced new problem categories.
Regional differences in complaints and requests
Country metadata opens up a different dimension. It is common to find that users in different markets have genuinely different experiences: not because of product differences, but because of local infrastructure, device distribution, use context, or expectation levels. A feature that works fine on high-end devices might generate complaints disproportionately from markets where mid-range devices are the norm. A UX pattern that is standard in one market might be confusing in another.
Metadata variables like country, device, and OS version are what transform a flat pile of reviews into a structured analysis. The technique is the same whether you are working with app reviews or any other qualitative dataset: you code the content for themes, and then you see how those themes distribute across the metadata dimensions you care about.
Sentiment shifts after releases or events
Tracking the proportion of positive, neutral, and negative reviews over time (broken down by theme) shows you how user perception shifts in response to what your team does. A major UX redesign might improve sentiment around discoverability while simultaneously generating complaints about familiarity and muscle memory. An infrastructure upgrade might resolve performance complaints while introducing authentication issues.
This kind of before-and-after comparison is difficult to do with aggregate star ratings alone, because ratings include reviewer sentiment about everything at once. Theme-based analysis lets you isolate the specific dimensions that changed.
The gap between what users say and what they rate
One genuinely useful pattern in review data is the divergence between star rating and text content. Users who give three stars and describe a specific friction point are often more actionable than users who give one star and write "terrible app." A systematic reading of mid-range reviews often surfaces improvement opportunities that the one-star pile obscures. Sorting purely by rating tends to prioritise the loudest voices rather than the most actionable ones.
Setting up a systematic analysis
The practical workflow for app review analysis is not complicated, but it does require some upfront structure.
Step 1: Export and clean your data. Pull the full review history, or at minimum the past 12-18 months. Remove obviously non-review entries (test submissions, spam). Standardise the date format and make sure the version field is clean. If you are combining iOS and Android reviews, add a platform column.
Step 2: Define your coding framework. Before you start labelling reviews with themes, spend time thinking about what categories matter for your product. A basic framework might include: performance and stability, UI and design, specific features (named), pricing and value, onboarding and setup, customer support, and comparison with competitors. You can refine this as you go, but having a starting framework prevents every review from becoming a unique category.
Step 3: Code a sample to calibrate. If you are using AI-assisted coding (which you will need to at any real scale), run a sample of 50-100 reviews through manually first and check the results. This calibration step catches category definition problems early and gives you a sense of what the tool is handling well versus where it needs adjustment.
Step 4: Run the full dataset. With a structured approach, coding several hundred or even a few thousand reviews becomes feasible. Tools built for qualitative data analysis handle the heavy lifting here. The goal is consistent, auditable coding where you can trace any aggregate finding back to the specific reviews that generated it.
Step 5: Cross-tabulate by metadata. Once everything is coded, the interesting work starts. Filter by app version to see complaint profiles by release. Slice by country to look for regional patterns. Compare iOS vs Android. Look at how theme distribution shifts over time.
The whole process, from raw CSV to a coherent analysis with version-specific and regional breakdowns, is the kind of workflow covered in more detail in the guide on import and export workflows with Skimle.
AI-assisted coding at scale
The reason app review analysis has traditionally been impractical is volume. Manually coding 2,000 reviews takes days. But with AI-assisted analysis, coding the same corpus takes hours, and the quality can match (and sometimes exceed) manual coding for well-defined categories.
The key caveat is that AI tools for qualitative analysis are not all equivalent. A general-purpose language model like ChatGPT can help you summarise or cluster a batch of reviews, but it is not designed for systematic, auditable thematic coding. The main limitation is traceability: when you ask an LLM to identify themes, you get a summary, not a coded dataset where every observation is tagged and every aggregate finding links back to source data.
Structured qualitative analysis tools take a different approach. Rather than summarising the data, they code each item individually against a consistent framework, which means you can interrogate the results, check specific categories, and have confidence that the output reflects the full corpus rather than a sample the model happened to weight more heavily. This matters especially for review analysis, where the interesting patterns often involve small but consistent signals across hundreds of items.
Advanced AI tools like Skimle go a step further and also create the categories based on the data. So you don't need to anticipate what themes to look for, rather the coding taxonomy is built based on the data itself. This is useful for spotting emerging trends. With Skimle, you can also then merge, edit and delete categories as well as manually edit how each piece of feedback is coded for maximum control.
Transparency in how the AI reaches its conclusions is also worth thinking about. Two-way transparency between the AI's coding decisions and the source data is what allows you to validate findings and present them to stakeholders with confidence. Without it, AI-assisted analysis is a black box, and black boxes are hard to act on. For product teams looking to connect review analysis into broader AI workflows, agentic chat and MCP shows how Skimle's structured analysis can be accessed by other AI tools in your stack.
Connecting review analysis to the rest of your feedback stack
App reviews should not exist in a silo. The most useful analyses connect review themes to other data sources: support ticket categories, NPS verbatims, user interviews, and session recordings.
When the same theme appears across multiple channels, the signal is much stronger than any single source alone. If performance complaints spike in reviews after a release, and support tickets about crashes also increase, and the App Store rating dips in a specific country, you have convergent evidence for a real problem. If the complaint only shows up in reviews, it may still be real but warrants more investigation before escalating.
This multi-source approach to qualitative feedback is part of what makes analysing customer feedback with Skimle different from just looking at each channel in isolation. The ability to import multiple data sources and code them with a shared taxonomy means you can compare across channels and see where signals converge.
Review analysis also feeds well into market research workflows. The market research use case is worth exploring if you are using competitive review analysis alongside your own app data, and the product managers use case covers how to build a cumulative knowledge base from customer signals across channels, which is one of the more powerful applications: comparing your app's complaint profile to a direct competitor's review corpus to identify relative weaknesses and unaddressed user needs.
Common mistakes to avoid
A few patterns come up repeatedly when teams start doing systematic review analysis for the first time.
Treating star rating as the primary signal. Rating is a useful aggregate but a poor analytical unit. Two different users can give the same rating for completely different reasons. Theme-based analysis of the text is where the actionable detail lives.
Analysing recent reviews only. There is a natural pull toward recency, but historical analysis is where version comparisons become possible. You need enough longitudinal data to see how the complaint profile has changed over time.
Creating too many categories. A 40-category coding framework applied to 1,000 reviews produces a lot of small cells with weak signal. Start with broader categories and split them only when a category is generating enough volume to merit subdivision. Skimle does this automatically for you.
Not linking back to source reviews. Any aggregate finding should be checkable. If "notification issues" accounts for 14% of reviews in version 4.2, you should be able to pull up the actual reviews in that category and read them. If your analysis tool does not support this kind of traceability, findings are harder to validate and harder to act on.
Analysing reviews without involving the product team. Review analysis done by a single analyst and presented as a slide deck tends to have limited impact. The more useful pattern is involving PMs and engineers in the coding framework design and the interpretation of results, so findings connect directly to product decisions rather than sitting in a report.
What the payoff looks like
A well-run app review analysis typically produces a few high-value outputs. Version-specific breakdowns tell the engineering team where specific releases introduced regressions. Regional analysis tells the localisation and growth teams where experience gaps exist. Longitudinal theme tracking tells leadership whether product quality is improving or deteriorating on specific dimensions over time. Feature request coding tells the roadmap team what users are asking for in their own words, with volume data attached.
None of this requires a research team or a sophisticated data infrastructure. It requires treating the review corpus as a dataset worth analysing properly, with a structured approach to coding and a habit of asking what the metadata dimensions reveal. The data is already there. Most of the work is in the method.
Ready to start treating your app reviews as a proper qualitative dataset? Try Skimle for free and see how structured AI-assisted analysis handles review corpora at scale, with full traceability from every theme back to source reviews.
Want to go deeper on qualitative analysis methods? Read our guides on thematic analysis, analysing open text responses at scale, using metadata variables to find patterns in qualitative data, and how to synthesise user research.
About the authors
Henri Schildt is a Professor of Strategy at Aalto University School of Business and co-founder of Skimle. He has published over a dozen peer-reviewed articles using qualitative methods, including work in Academy of Management Journal, Organisation Science, and Strategic Management Journal. His research focuses on organisational strategy, innovation, and qualitative methodology. Google Scholar profile
Olli Salo is a former Partner at McKinsey & Company where he spent 18 years helping clients understand the markets and themselves, develop winning strategies and improve their operating models. He has done over 1000 client interviews and published over 10 articles on McKinsey.com and beyond. LinkedIn profile
Frequently asked questions
How do I export my App Store reviews as a CSV?
In App Store Connect, go to the Reviews section for your app and use the export button to download a CSV. For larger archives or automated exports, Apple's App Store Connect API lets you pull review data programmatically using a JWT-authenticated endpoint. Third-party tools like Appbot, AppFollow, and Sensor Tower also aggregate reviews from both Apple and Google and export them in a unified format.
How do I match reviews to specific app versions for version-based analysis?
Both the App Store and Google Play include version information in their review exports. On iOS, the version field reflects the app version the user had installed when they wrote the review. On Android, you get the version code. Once you have the version column in your dataset, you can filter and cross-tabulate themes by version in any analysis tool. The key is to keep the version data intact through your import and coding process so the metadata stays linked to each coded item.
How many reviews do I need before analysis becomes meaningful?
There is no hard threshold, but analysis starts to become reliable at around 100-200 reviews per time period or segment you want to compare. With fewer reviews, individual outliers can heavily influence theme proportions. If your app is newer or your volume is low, consider pooling reviews over a longer time window (six to twelve months) rather than trying to compare monthly slices, and focus on broader theme categories rather than granular sub-categories.
How do I handle reviews in multiple languages?
If your app has users across multiple countries, you will likely have reviews in several languages. The most practical approach is to either translate all reviews into a single language before coding, or use an analysis tool that handles multilingual input natively. Skimle handles analysis across multiple languages without requiring manual translation, which matters when you want regional metadata to stay accurate and meaningful throughout the analysis.
How do I present review analysis findings to stakeholders who are sceptical of qualitative data?
The most effective approach is to lead with the metadata patterns rather than individual quotes. Showing that "performance complaints increased from 8% to 22% of reviews between version 3.4 and 3.5, and are concentrated among Android users in Southeast Asia" is more persuasive to a data-oriented audience than presenting three vivid one-star reviews. Combine the quantitative pattern with a small selection of representative quotes to give the numbers texture. Traceability also matters: if stakeholders can click through from an aggregate finding to the underlying reviews that generated it, scepticism about cherry-picking tends to dissolve.