To analyse customer interviews at scale: structure your interview programme with consistent discussion guides and metadata capture from the start; use an inductive first pass to let themes emerge before applying your predefined framework; run synthesis across the full dataset rather than interview by interview; and use AI-assisted tools like Skimle to surface cross-interview patterns and minority views that manual reading misses. For 30+ interviews, manual-only analysis is not a method. It is a liability.
Ten customer interviews is a manageable reading task. Fifty is a research programme. A hundred is a corpus.
The difference is not just volume. At scale, patterns that were invisible at ten interviews emerge clearly. Minority views that would be missed in a small sample become visible. Segment differences (enterprise vs SMB, new customers vs long-tenured, churned vs retained) become statistically meaningful. The analytical question shifts from "what did people say?" to "what does this dataset tell us, and who says what differently?"
But getting there requires the right infrastructure from the start. A team that runs 50 interviews with inconsistent guides, no metadata capture, and no analysis plan will spend more time organising data than analysing it.
This guide is for market research agencies running multi-interview client studies, product teams with ongoing customer interview programmes, and CX teams running large-scale research projects. If you are new to customer interview analysis in a market research context, how to analyse customer interviews in market research and our overview of qualitative market research are good starting points.
What breaks down at scale
Manual interview analysis has a ceiling. The research on this is consistent: manual coding of qualitative transcripts runs at roughly two to four hours of analyst time per hour of interview material. A study with 25 one-hour interviews requires 50 to 100 hours of coding time (two to three weeks of full-time work) before synthesis even begins.
At that pace, studies of 30 interviews are ambitious, 50 are rare, and 100 are institutional projects with multi-person teams and multi-month timelines. Most teams respond by keeping samples small: the typical commercial interview study runs 8 to 15 participants because that is what one researcher's working memory can hold. The consequence is that most customer research leaves the majority of the important variation unexamined.
Three things break down as interview volume increases:
Working memory. A researcher reading 15 interviews can hold the full dataset in their head. At 40 interviews, they cannot. The 38th interview gets less analytical attention than the 5th. The themes that emerge reflect what was fresh in memory during synthesis rather than what was most frequent across the dataset.
Consistency of coding. Manually applying codes across a large dataset without a structured framework produces drift: the same passage might be coded as "pricing concern" in interview 12 and "value perception" in interview 37, because the analyst's frame shifted between sessions. At scale, inter-rater drift within a single analyst is as much of a problem as disagreement between two analysts.
Traceability. At 50 interviews, "several participants mentioned X" is an assertion. At 10 interviews, it was a credible summary. When the client or stakeholder asks "which participants?", the ability to answer that question precisely is what distinguishes a rigorous deliverable from an informed impression.
AI-assisted analysis tools address all three problems: they process the full dataset consistently, apply codes without drift, and link every theme to its source passages. The tools do not replace researcher judgement. They extend its reach across a dataset that would otherwise exceed a single human's analytical bandwidth.
How to structure your interview programme for analysis
The easiest way to make large-scale analysis harder is to design the data collection without thinking about what analysis will look like. The following decisions at the programme design stage dramatically affect analysis quality.
Does your discussion guide structure affect the analysis?
Yes, substantially. A consistent discussion guide across all interviews means that every participant was asked the same core questions in the same sequence. This creates comparability: you can compare how different participants answered "what drove your decision to renew?" without worrying that the question was phrased differently each time.
In practice, discussion guides should balance structure with flexibility. A fully rigid guide produces comparable data but misses unexpected directions. A fully open guide produces rich individual accounts but makes cross-interview comparison labour-intensive. The right structure for most commercial research: four to six core questions that every participant is asked (creating the comparable backbone), with two to three flex questions that the interviewer adapts based on what the participant says (allowing depth where it matters).
For guidance on writing discussion guides, see how to write a perfect interview guide.
What metadata should you capture?
Metadata is what makes segment analysis possible. Without it, you can tell clients what themes you found; with it, you can tell them which customer types hold which views, which is almost always the more valuable finding.
At minimum, capture:
- Customer segment (enterprise / mid-market / SMB, or your client's segmentation)
- Tenure (new customer: less than 12 months; established: 12 to 36 months; long-tenured: more than 36 months)
- Geography (country or region, if your research covers multiple markets)
- Deal size or contract value band (particularly for B2B research)
- Decision-maker vs user (particularly relevant for B2B, where the buyer and the user are often different people)
- Outcome variable (retained, churned, expanded, at-risk; if your research is linked to a CRM)
Tag each interview document with its metadata before uploading to your analysis tool. Retrospectively tagging after analysis is possible but slower and error-prone.
Skimle's metadata analysis accepts these fields and allows you to slice all findings by any attribute combination. The guide on discovering themes using metadata variables explains the practical workflow.
Coding strategy: inductive first pass vs predefined framework
The most important analytical choice in large-scale interview research is the coding approach. The two main options are inductive and deductive (predefined), and the right choice depends on how much you already know before you start.
When should you use inductive coding?
Inductive coding lets themes emerge from the data rather than being imposed from a predefined framework. It is the right choice when:
- The research question is exploratory in the fullest sense ("what matters to customers?" rather than "how do customers rate these five attributes?")
- You are entering a new market or customer segment you do not understand well
- A previous wave of research with a predefined framework produced surprising findings you want to investigate without constraint
- You want to discover what you did not think to ask about
In an inductive workflow, the AI analysis runs across all interviews and surfaces the themes that appear across the dataset without being told what to look for. The researcher then reviews those themes, refines the labels, and decides whether to merge, split, or add categories.
When should you use a predefined framework?
Predefined frameworks (also called deductive or top-down coding) are right when:
- You are running a repeat study against an established set of topics (brand tracking, customer satisfaction, win-loss analysis with fixed criteria)
- You need findings to be comparable to a previous wave
- You are coding against a known rubric (a jobs-to-be-done framework, a specific set of product attributes, a set of strategic hypotheses)
- The client has defined the research questions and you need to answer them systematically
In a predefined workflow, you give the analysis tool your coding framework before it starts. Every interview is coded against those categories, and findings are automatically comparable across the full dataset and against previous waves.
Most commercial research projects benefit from a combination: run an inductive pass first to see what emerges, then apply your predefined framework to structure the findings. The inductive pass often surfaces something important that the research brief did not anticipate.
For more on the coding approach decision, see inductive vs deductive coding: when to use each.
How to find signal across the full dataset
Running analysis across 50+ interviews produces more findings than any one research deliverable can use. The challenge is not finding themes. It is finding the themes that matter, for the audience you are reporting to, at the level of detail they need.
What are the most significant inter-segment differences?
The most commercially valuable finding in most customer research is not the aggregate picture but the contrast between segments. If enterprise customers and SMB customers hold completely different views about product value, that is a pricing and positioning insight. If new customers and long-tenured customers experience the onboarding differently, that is a customer success issue. If churned customers systematically mention a feature gap that retained customers never mention, that is a product roadmap signal.
Finding these differences at scale requires that segment metadata is attached to every interview and that the analysis tool can slice themes by those attributes. At 50+ interviews with metadata, these patterns become statistically visible; at 15 interviews without metadata, they are guesswork.
How do you surface minority views that matter?
In a large interview dataset, a theme mentioned by 8% of participants might be easy to dismiss as an outlier. But if all the 8% come from your highest-value accounts, or if they are all churned customers, the minority view is more commercially significant than the majority one.
Skimle's Visualisations show theme frequency across the full dataset and by metadata segment, making it possible to spot exactly this pattern: a theme that is rare in aggregate but concentrated in a strategically important subgroup.
This kind of analysis is what separates a research deliverable that says "most customers are satisfied" from one that says "long-tenured enterprise customers are satisfied, while new SMB customers are struggling with onboarding (three of the last four churned accounts mentioned this)."
What patterns appear at the document level?
Some of the most interesting findings in large-scale interview research come from looking at individual documents rather than aggregate patterns. Which specific interviews are outliers (extremely positive or extremely negative compared to the mean)? Which interviews contain the richest, most specific evidence for a theme? Which participants are the best candidates for follow-up?
Skimle's document view lets you move from the aggregate findings back to individual transcripts, reading the full context of any passage that contributed to a theme.
From synthesis to deliverable: different audiences need different outputs
A 50-interview study produces enough material for multiple deliverables, each structured differently for its audience. Getting this translation right is as important as the analysis itself.
What does a client report need?
An agency delivering findings to a client needs a narrative that answers the client's business question, supported by evidence but not buried in it. The structure: executive summary (three to five key findings), thematic body (each theme with supporting quotes and frequency data), segment breakdown (how findings differ across the customer groups the client cares about), and implications (what these findings suggest the client should do).
The common mistake is delivering a data summary instead of an interpretation. Clients do not need a count of how many participants mentioned each theme; they need a view on what those themes mean for their business.
For guidance on this translation, see presenting qualitative research findings to executives.
What does a product team need?
An internal product team running customer interview research needs different outputs from an agency delivering a client report. They typically need:
- A synthesis of the top unmet customer needs, with supporting evidence
- A breakdown of which customer segments have which needs (to inform prioritisation)
- Individual quotes they can share with engineering or design to illustrate why a feature matters
- A live repository they can search by topic when specific questions come up
For product teams, see how to synthesise user research and building a research repository that people actually use.
What does a market research deliverable differ from an internal one?
Market research agencies have an additional obligation that internal teams do not: the deliverable must be legible to a client who was not present for the interviews and did not see the raw data. Every finding needs to be supported by evidence that the client can inspect, and the methodology needs to be described precisely enough that the findings are defensible.
This is where traceability from every theme to its source passages matters commercially, not just methodologically. A client who asks "which participants said this?" and gets a precise answer is a client who trusts the research. One who gets "several participants mentioned it" is a client who may commission a follow-up study to verify.
Quality assurance at scale: how to check AI-generated themes
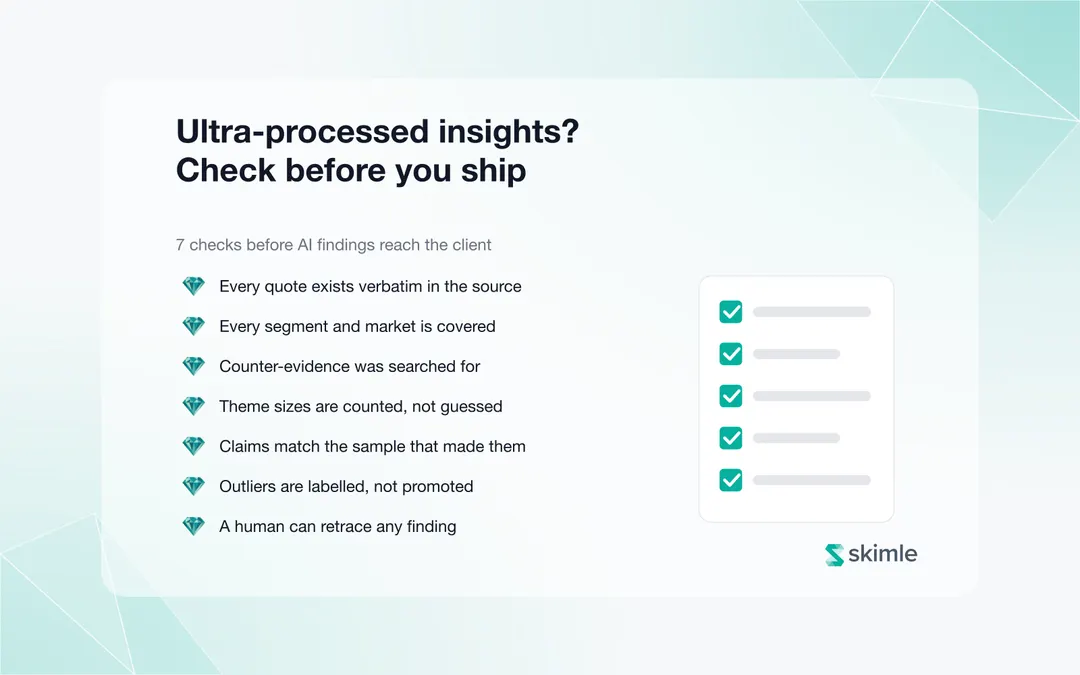
AI-assisted analysis at scale introduces quality risks that manual analysis at small scale does not have. The main ones are:
Theme conflation. An AI analysis may group two related but distinct themes under a single label because they appear in similar linguistic contexts. A theme called "support quality" might be hiding a distinction between "response time" (where customers are positive) and "resolution quality" (where they are not).
Missing themes. If a theme appears in only a small percentage of interviews, an inductive AI analysis may not surface it as a primary theme even when it is strategically important. Check for the themes you expected to find and investigate why they did not appear if they did not.
Overconfident frequency counts. An AI that codes 12 passages as "pricing concern" does not mean 12 participants have pricing concerns. The same participant may account for three of those passages. Check whether theme frequency reflects participant count or passage count.
Quote selection bias. AI tools select representative quotes to surface alongside themes. A well-chosen quote can make a minority view look like a majority finding. Check theme frequency data, not just the quotes presented.
A practical QA workflow: after receiving AI-generated themes, spend 30 to 60 minutes sampling 10 to 15 transcripts manually, checking whether the AI coding aligns with your own interpretation. Disagree with several codings? Refine the category definitions and re-run. Agree consistently? The analysis is reliable enough to use.
See our AI qualitative analysis checklist for a full list of verification steps before publishing AI-assisted research findings.
A note on sample size and saturation
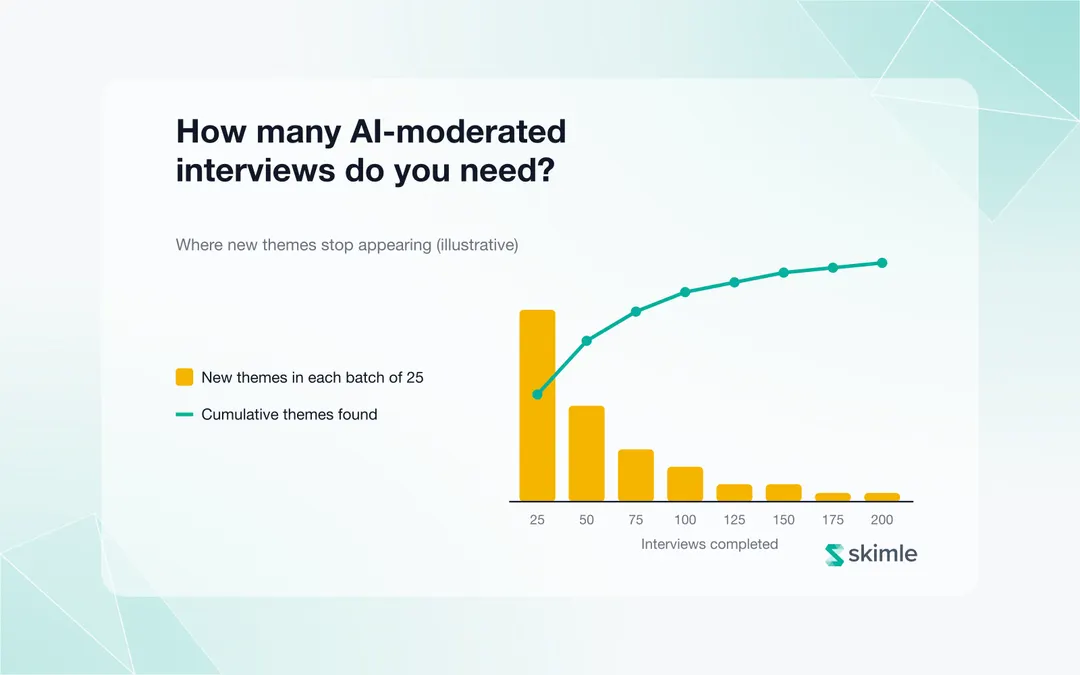
At what point does adding more interviews stop producing new themes? The concept of thematic saturation (the point at which new interviews are not adding new categories) is real, but it depends on the research question and the population.
For a homogeneous population with a focused research question (enterprise SaaS customers' views on a specific feature), saturation often arrives at 15 to 20 interviews. For a heterogeneous population with a broad research question (customer experience across all segments), saturation may not arrive until 40 to 60 interviews. And for detecting rare but important minority views (like the churned enterprise accounts who mentioned a specific gap), you may need more.
The practical implication: more interviews are almost always better for commercial research, provided the analysis infrastructure can handle them. The constraint is not sample size theory but analyst bandwidth, and that is exactly the problem AI-assisted tools address. When analysis no longer scales with researcher hours, a study can run 50 or 100 interviews instead of 12, and the findings are proportionally richer.
For a detailed treatment of qualitative sample size, see qualitative research sample size and how many interviews qualitative research.
The global context: interview research at scale is growing
ESOMAR's Global Market Research 2024 report estimated that the insights industry surpassed $150 billion in revenue, with research software growing at 11.5%, significantly faster than the broader industry. That growth reflects a shift: more teams are running qualitative interview research at larger scale, and they are looking for infrastructure that matches.
The traditional constraint on qualitative research at scale was not the cost of conducting interviews but the cost of analysing them. When analysis takes two to four hours per interview hour, a 50-interview study is a three-person-month project. When AI tools reduce that to hours, the same team can run three 50-interview studies in a quarter instead of one.
This is the change that is shifting qualitative research from a specialist methodology to a mainstream one. See the renaissance of qualitative research in the AI era for a broader perspective on this shift.
Frequently asked questions
How many customer interviews do I need for reliable thematic analysis?
For most commercial research questions, 15 to 25 interviews will surface the main themes. 30 to 50 interviews allow reliable segment comparisons. 50 to 100 interviews are appropriate for heterogeneous populations, multiple customer segments, or research where minority views in specific subgroups need to be visible. The right number depends more on the breadth of your population than on a fixed rule. See qualitative research sample size for a detailed treatment.
How long does it take to analyse 50 customer interviews?
With manual coding, 50 one-hour interviews will take 100 to 200 hours of analyst time to code and synthesise, approximately three to five weeks of full-time work for one researcher. With AI-assisted tools, the initial analysis runs in minutes and the researcher's time is spent reviewing and refining themes rather than performing the initial coding. In practice, AI-assisted synthesis of 50 interviews typically takes one to three days of researcher time rather than weeks.
Can AI analysis replace the researcher in customer interview synthesis?
AI analysis handles the volume problem (processing 50 interviews consistently without fatigue or drift) but does not replace researcher judgement. Deciding which themes matter for the business question, interpreting what a pattern means strategically, and structuring a narrative that a client or executive can act on are all human contributions. The best workflow combines AI for systematic coverage with researcher expertise for interpretation and communication.
How do I handle confidentiality in large-scale customer interview research?
For research involving sensitive business information or identifiable participants, pseudonymisation before analysis is important. This means replacing names, company names, and other identifying details with codes before transcripts are uploaded to an analysis tool. Skimle's anonymisation feature automates this step for transcript data. For GDPR-specific guidance, see how to anonymise interview transcripts.
Ready to analyse your customer interviews at scale? Try Skimle for free and upload your first batch of transcripts, get structured themes with full traceability, and slice findings by customer segment in minutes.
Related reading: See our guides on NPS verbatim analysis at scale, interview analysis software compared, thematic analysis complete guide, and our customer and market researchers use-case page.
About the authors
Henri Schildt is a Professor of Strategy at Aalto University School of Business and co-founder of Skimle. He has published over a dozen peer-reviewed articles using qualitative methods, including work in Academy of Management Journal, Organisation Science, and Strategic Management Journal. His research focuses on organisational strategy, innovation, and qualitative methodology. Google Scholar profile
Olli Salo is a former Partner at McKinsey & Company where he spent 18 years helping clients understand the markets and themselves, develop winning strategies and improve their operating models. He has done over 1000 client interviews and published over 10 articles on McKinsey.com and beyond. LinkedIn profile
Sources
- Scaling Customer Research: How to Interview 100+ Users Without Burning Out - Resonant
- AI Interview Analysis: Turning Hours of Transcripts into Decisions - Perspective AI
- ESOMAR Global Market Research 2024 - Research World
- Large Language Models for Large-Scale Qualitative Analysis - arXiv
- How to Scale Qualitative User Research Efficiently - Minds