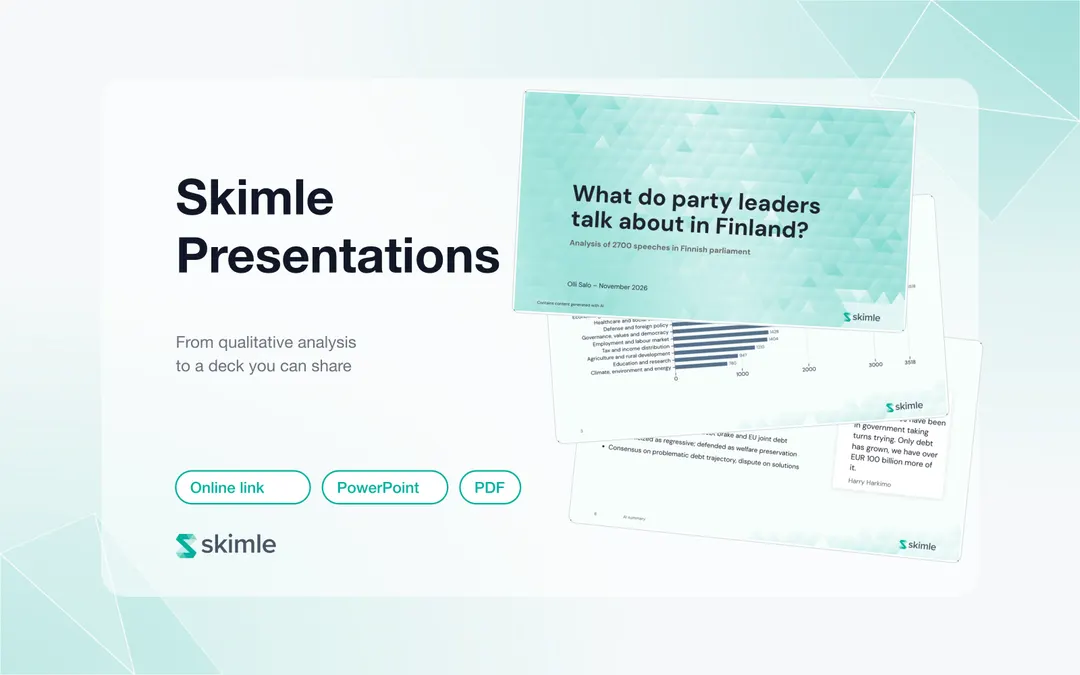
To turn qualitative research into a presentation in Skimle, run an analysis, then create a presentation from it. Skimle builds a draft deck with a data overview, a chart of the main themes and one slide per theme with an AI summary and attributed quotes. You edit and brand it, then share a public link, PowerPoint or PDF.
Most qualitative projects lose days between "the analysis is done" and "the deck is ready". In Lyssna's 2025 Research Synthesis Report, which surveyed 300 practitioners, 60.3% named time-consuming manual work as their biggest synthesis frustration, and 57.3% found organising findings into a coherent structure time-consuming. Presentations exists to shorten that last mile without cutting the thread between a slide and the quotes it rests on.
This guide walks through the feature using a real example, an analysis of 2,700 speeches by Finnish party leaders, and covers every step from creating the deck to sharing it.
The one-minute video below shows both halves: sharing a finished deck as a link, PowerPoint or PDF, and building one by starring categories and charts in your analysis.
What does a finished Skimle presentation look like?
The quickest way to understand the feature is to open one. What do party leaders talk about in Finland? is a published Skimle presentation built from every speech Finland's party leaders gave in parliament over three and a half years: 2,700 speeches, broken into 15,600 individual points and sorted into 11 main themes and 154 subthemes. It has 11 slides.
The deck follows the shape most qualitative readouts share. The image below shows six of its slides: the title slide, a "data at a glance" slide with the corpus counts, a bar chart of insights per category, a heatmap of themes by speaker, a theme slide with its summary and quotes, and a word cloud.
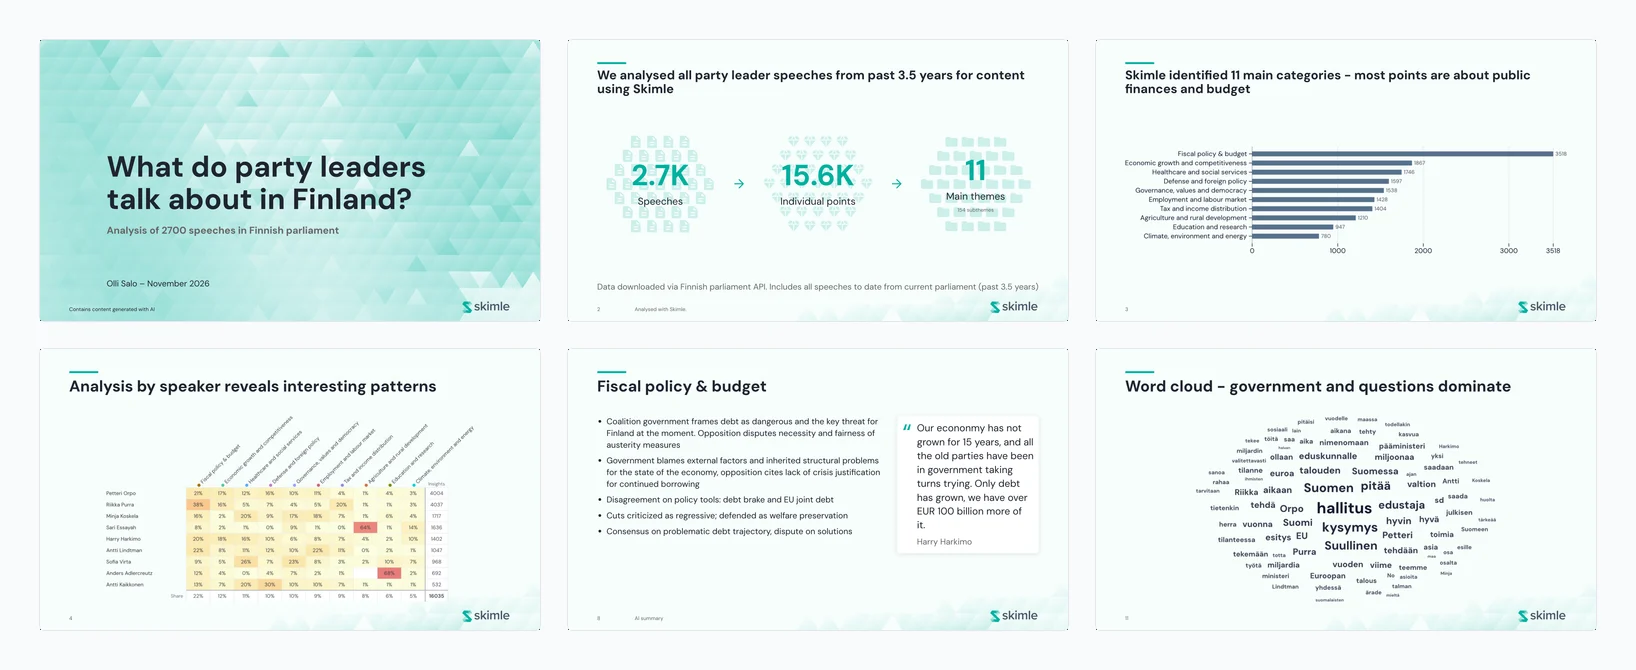
Three things about it are typical of a Skimle presentation:
- The numbers come from the analysis, not from a spreadsheet you rebuilt by hand. The counts on slide 2 and the bars on slide 3 are drawn from the project itself.
- Every theme slide carries evidence. Bullet points summarise the theme and quotes on the right are attributed to the speaker who said them.
- The headlines are human. "Topics remain relatively stable over time, agriculture has been the growing topic" is an interpretation the author wrote. Skimle drafts the structure, and the researcher supplies the "so what".
How does Skimle Presentations work?
A presentation in Skimle is a set of slides that stay linked to the project they came from. Each slide is built from something in your analysis: a category with its summary and quotes, a chart from Visualisations, a set of hand-picked quotes, or text you write yourself.
Because the link is kept, the deck behaves differently from a PowerPoint file you assemble by copying and pasting:
| Copy-paste deck | Skimle presentation | |
|---|---|---|
| Where the numbers come from | Retyped from the analysis tool | Drawn from the project |
| What happens when the analysis changes | Nothing, the deck silently goes stale | Affected slides are marked out of date and can be refreshed |
| Quotes | Pasted, often without a source | Picked from the category, shown with their source |
| Sharing | Email an attachment | A public link that updates, or a PowerPoint or PDF download |
| Branding | Applied slide by slide | Team colours, fonts, logo and background applied to every slide |
You find Presentations in the Export section of your project, next to Data export.
Step 1: run an analysis to present
A default presentation is built from what an analysis found, so you need at least one analysis with categories or quotes before you start. Any analysis works: one built from predefined categories, where Skimle suggests the themes or you load your own framework, or an agentic analysis that answers a research question.
The quality of the deck is set here, not in the slide editor. Before you build slides, spend the time in the categories view merging near-duplicate themes, renaming categories into words your audience uses, and reading the quotes behind the largest categories. A presentation inherits its theme names and summaries from the analysis, so a messy category tree produces a messy deck.
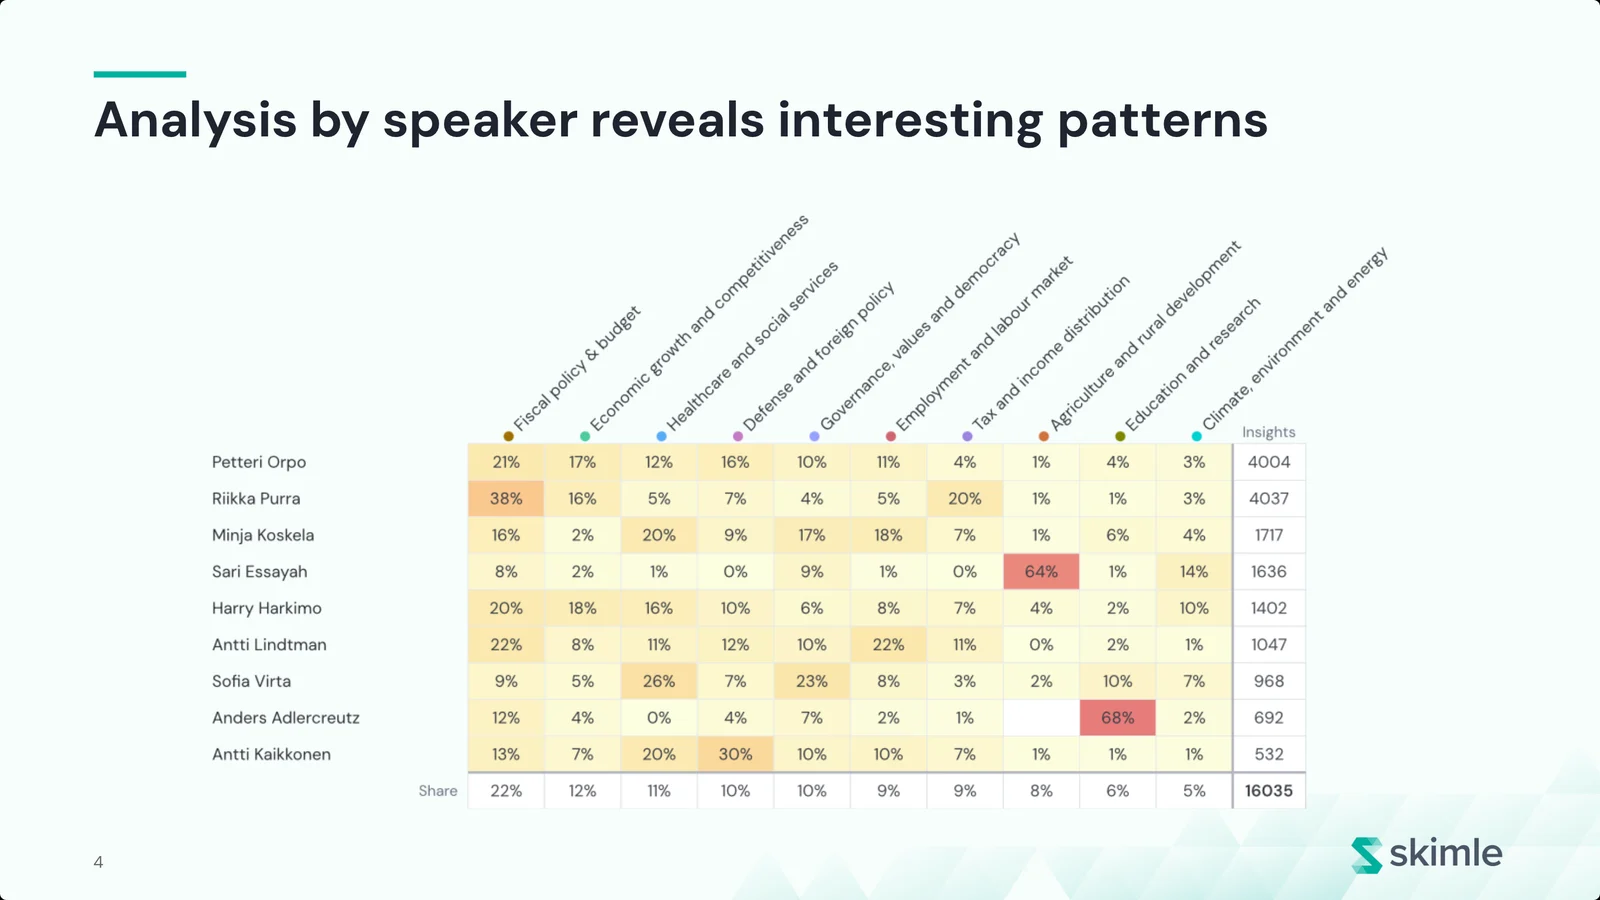
The example is political science, a typical use for academic researchers who present conference talks and project reviews from interview or document data. If your data has metadata such as role, segment or region, add it before you build the presentation. Charts like the speaker heatmap in the example come from metadata analysis, and they are often the slides that make a room sit up.
Step 2: create the presentation
Open Presentations and choose New presentation. The dialog asks four things:
- Name. Something your audience recognises, such as "Findings for the board".
- Covers. What the presentation reports on: the whole project or one analysis. This cannot be changed later, so pick the analysis you mean to present.
- Language. The language for the titles and labels Skimle adds to slides. Your quotes and insights stay in their original language, so a project analysed in English can produce a Finnish deck for a Finnish board, or the other way round. This also cannot be changed later.
- Start from. Choose Default to have Skimle build sections, charts and slides from the data, or Blank to start empty and add saved items yourself.
There is also an AI setting, Auto-generate descriptions. When it is on, any insight, category or note you add later gets a description written for it. You can turn it off under AI settings in the presentation and edit any text the AI writes.
Step 3: review what the default presentation contains
A default presentation is built in a few seconds while Skimle draws your charts and places your slides. It typically contains:
- A title slide with the project name, your name and date, and a small "contains content generated with AI" note.
- Data at a glance: the number of documents, coded insights and themes behind the analysis.
- Main themes and Insights per category: the themes ranked by how many insights they hold. These count coded points, not people: one talkative interviewee can add many insights to a theme, so say "mentioned in 28 of 39 interviews" when breadth is what you mean. Theme slides can show that breadth in their footer, as in "Mentioned in 28 of 39 documents".
- One slide per theme, labelled "AI summary", with the theme's summary as bullets and up to two attributed quotes beside it.
- Section dividers grouping the theme slides.
The theme slides are the core of the deck. The example below is the "Fiscal policy & budget" slide: five bullets summarising what the speeches say, and a quote from Harry Harkimo that makes the summary concrete.
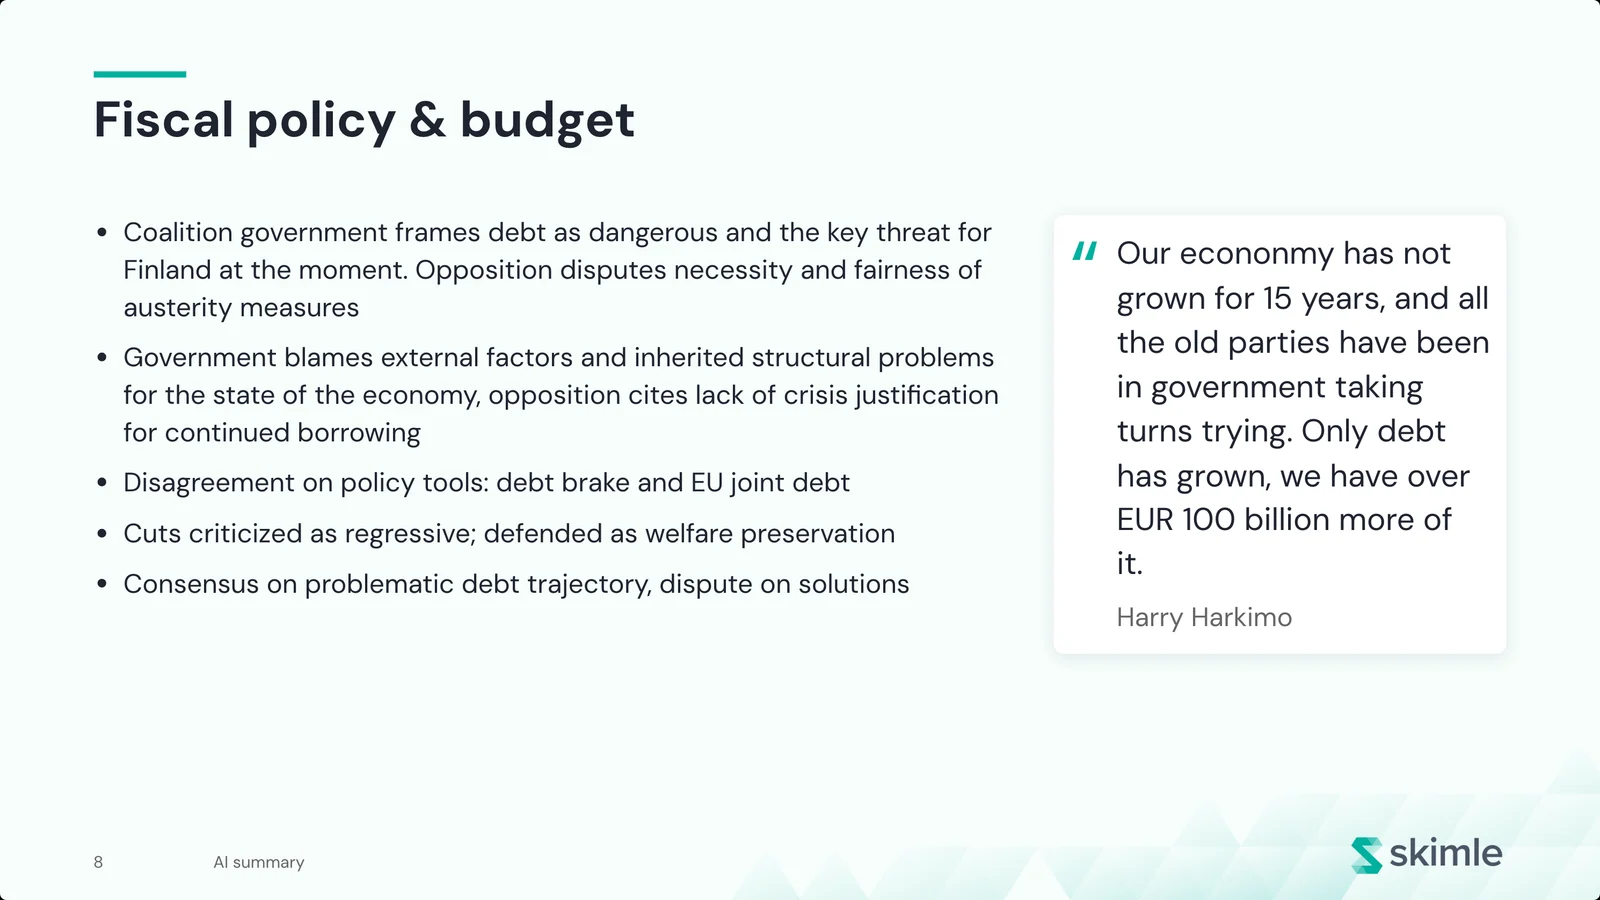
Read every theme slide before you go further. The summary reflects the analysis, so if a bullet surprises you, open the category in Skimle and check the insights behind it. That habit is what makes the deck defensible when someone in the room asks "where does that come from?".
Step 4: edit the slides and the storyline
A default deck is a first draft. The editor lets you reshape it into an argument:
- Rewrite titles as findings. "Healthcare and social services" is a label. "Both sides agree the welfare system is in crisis, and disagree on why" is a finding. Click any title or text to edit it.
- Choose the quotes. Open a theme slide's Slide options and pick Choose quotes to see every quote from that category and its subcategories. Two quotes fit best on one slide; more continue on the next. You can also turn quote marks and quote sources on or off.
- Choose the themes on chart slides. On the Main themes and Insights per category slides, tick which categories appear. They are shown largest first.
- Add slides. Use Add slide for a blank text slide, a quotes slide (quotes from across the project, not just one category), a section divider, or any item you have saved.
- Reorder and regroup. Drag slides in the outline, add sections, and remove a section either with its slides or keeping them. Switch between list and grid view to see the whole storyline at once.
Your edits are marked on each slide, so you can always tell which wording is yours and which came from the analysis. Most edits can be undone. You can also duplicate a presentation to make a shorter executive version without touching the full one.
For a 30-minute readout, aim for 10 to 15 slides; the example deck has 11. Hide or remove theme slides that do not support your argument rather than presenting every category the analysis found. This is where most of the time should go. The structure of a good qualitative readout, a claim, the evidence for it and what it means, is described in our guide to presenting qualitative research findings to executives. Skimle gives you the evidence half of each slide. The claim and the "so what" are yours to write.
Consultants and research agencies who present to clients every week will recognise this workflow. See how Skimle fits market research and customer insights teams and consultants.
Step 5: save evidence from anywhere in Skimle
You rarely know every slide you need when you start. Skimle lets you collect material while you explore: press the star on an insight, a category or a note, or choose Save for Presentations on a chart in Visualisations. The item is saved to the project and can be placed straight into one or more presentations.
This works well with agentic chat. Ask a question, follow the citations to the quotes behind the answer, and star the insights you want to show. When you next open the presentation, they are waiting under Add slide, already linked to their source.
Charts are saved as pictures of what you configured in Visualisations. The speaker heatmap below is one: themes run across the columns, party leaders down the rows, and each cell shows the share of that leader's points that fall in the theme.
Step 6: apply your brand and look
A team can set a presentation brand that every presentation uses: accent, text and page colours; heading and body fonts, with separate choices for Latin, Chinese, Japanese and Korean, and Arabic scripts; a logo with its corner and size; and a background. The background can be a generated triangle pattern (with a Regenerate button and adjustable opacity), an image you upload, a plain colour, or nothing. You can also choose whether body slides show a faded version of the background and whether slides are numbered.
Only team owners can change the team brand. Any single presentation can override any of these settings for itself, and Use the team brand clears the override again. The example deck uses the default Skimle look: a teal triangle pattern on the title slide and a faded version on the body slides.
Step 7: present, publish or download
When the deck is ready, you have four ways to get it in front of people.
| Option | What you get | Best for |
|---|---|---|
| Present | Full-screen presenter view in the browser | Presenting live from Skimle |
| Publish | A public link anyone can open, with full-screen and slide grid views | Sharing with stakeholders who will read it on their own |
| Download | A PowerPoint file, rendered from the same pages you see | Decks that need further editing or a corporate template |
| Your browser's print dialog, ready to save as PDF in landscape | Attachments and archives |
Publishing deserves a closer look, because it changes how qualitative findings travel inside an organisation. When you publish, Skimle creates a public link (the example deck is one). You choose how the link updates: automatically, so your edits reach the link within a minute, or when you publish again, so the link keeps showing a fixed version until you decide to update it. The panel shows whether the link is up to date, and Stop sharing turns the link off for everyone. If you publish again later, you get a new link.
Viewers do not need a Skimle account. They see a start screen, step through the slides with arrow keys or buttons, can open a grid of all slides, and can switch to full screen.
Publishing needs permission to share and export the project, and a team that does not allow outside members cannot publish public links at all, so check with your team owner if the Publish button is locked. Anyone with the link can view the presentation, so publish only material you have the right to share. If your data includes personal details, anonymise the documents before analysis, or choose quotes that do not identify anyone.
If you need a long-form written report rather than slides, use Quick export in Data export to export a Word report with numbered sections, category summaries and quotes. An agentic analysis also writes its own research report.
How do you keep a presentation up to date?
Qualitative projects rarely stop at one round of data. You add interviews, rerun an analysis, or merge two categories after a workshop. Skimle tracks this. When the source behind a slide changes, the slide is marked Out of date, and Refresh out of date brings them all back in line with the analysis in one click.
If you edited a slide's wording, Skimle tells you before refreshing, because refreshing replaces the title and text with what the source says now. Charts saved as pictures cannot always be refreshed automatically. Those slides warn you when their data has changed, and you save the chart again from Visualisations to update it.
Several people can work on the same presentation. If a colleague changes it while you have it open, your view picks up their changes, and a link set to update automatically picks them up too.
5 tips for a qualitative presentation people act on
The feature handles the mechanics. These habits, drawn from presenting a lot of interview research to boards and leadership teams, decide whether the deck changes anything:
- Lead with the answer. Put the two or three findings that matter on the first content slide. The data-at-a-glance slide can follow as proof of rigour.
- Write every title as a sentence. A reader skimming only the titles should get the whole argument. The example deck does this on its overview slides: "Skimle identified 11 main categories, most points are about public finances and budget".
- Use quotes as illustration, not proof. Braun and Clarke's widely cited guide to thematic analysis recommends choosing vivid extracts that capture the essence of a point. A quote shows what a theme sounds like. The count and the summary show how widespread it is.
- Show disagreement. Where groups differ, as government and opposition do in the example, a heatmap or a two-quote slide is more convincing than a single "consensus" bullet. Metadata analysis is the quickest way to find these splits.
- Keep the link to the evidence. Publishing a Skimle presentation instead of emailing a detached file means the deck can be updated when someone challenges a finding, and the analysis behind it stays one click away for your team.
If you write longer topline reports alongside the deck, our qualitative topline report template covers the written equivalent.
Frequently asked questions
Can I export a Skimle presentation to PowerPoint?
Yes. The Download button saves the presentation as a PowerPoint file, rendered in your browser from the same pages you see in the editor. You can then edit it further or move the slides into your organisation's template.
Do viewers need a Skimle account to see a published presentation?
No. Anyone with the public link can open and step through the presentation, view all slides as a grid and go full screen. You can stop sharing at any time, which turns the link off for everyone.
Can a presentation be in a different language from my data?
Yes. When you create a presentation you choose its language. The titles and labels Skimle adds are written in that language, while quotes and insights stay in their original language. Skimle analyses data in over 100 languages, so this works for multilingual projects too.
What happens to my presentation when I rerun the analysis?
Slides whose source has changed are marked out of date, and you can refresh them all in one step. If you have edited a slide's text, Skimle asks before replacing your wording. Slides whose source was deleted keep the version that was saved.
How much does Skimle Presentations cost?
Presentations is included in Skimle. Credits are charged when documents are added to a project, and analysis, chat and presentations do not cost extra. You can start with a free trial with no credit card, and paid plans start at €20 per month. See pricing for details.
Ready to turn your analysis into a deck? Try Skimle for free, run an analysis on your own interviews or open-ended responses, and have a first presentation ready the same day. You can see more examples on the Skimle Presentations page.
Want to go deeper? Read how to code qualitative interviews with AI in Skimle, how to use agentic analysis, and how Skimle compares with other tools in our qualitative data analysis tools comparison.
About the authors
Henri Schildt is a Professor of Strategy at Aalto University School of Business and co-founder of Skimle. He has published over a dozen peer-reviewed articles using qualitative methods, including work in Academy of Management Journal, Organisation Science, and Strategic Management Journal. His research focuses on organisational strategy, innovation, and qualitative methodology. Google Scholar profile
Olli Salo is a former Partner at McKinsey & Company where he spent 18 years helping clients understand the markets and themselves, develop winning strategies and improve their operating models. He has done over 1000 client interviews and published over 10 articles on McKinsey.com and beyond. LinkedIn profile
Sources
- The biggest research synthesis challenges (and how to solve them), Diane Leyman, Lyssna, 2025 (2025 Research Synthesis Report, 300 practitioners)
- Using thematic analysis in psychology, Braun and Clarke, 2006, Qualitative Research in Psychology 3(2), 77-101
- What do party leaders talk about in Finland? A published Skimle presentation