An in-depth interview (IDI) is a one-on-one, semi-structured conversation used to explore an individual's attitudes, motivations, or experiences in detail. Analysing IDIs means transcribing each conversation, coding it against a consistent framework, then comparing themes across respondents (cross-case analysis) rather than treating each interview as a standalone story. Tools like Skimle apply that framework consistently across 20, 40, or 100+ IDIs while keeping every theme traceable back to the respondent who said it.
What is an IDI, and how is it different from a focus group?
IDI stands for in-depth interview: a term used specifically in market research to distinguish a one-on-one, semi-structured conversation from a group discussion. The moderator follows a discussion guide but has room to probe, follow up, and let the conversation go wherever it is most revealing, which is what "semi-structured" means in practice.
The distinction from a focus group is not just about numbers. An IDI gives you depth on one person's individual reasoning without social pressure shaping their answers. A focus group gives you interaction, the way opinions shift or harden when people hear each other, at the cost of a quieter participant's candid view sometimes getting lost. If you are still deciding between the two formats, our guide on focus groups vs individual interviews covers that decision in more depth.
When should you choose IDIs over a focus group?
| Situation | Better fit |
|---|---|
| Topic is sensitive, personal, or socially undesirable to admit in a group (finances, health, workplace conflict) | IDI |
| You need to understand an individual decision-making process step by step | IDI |
| Participants are geographically dispersed or hard to schedule together | IDI |
| You want to see how opinions form, spread, or get challenged socially | Focus group |
| Budget and timeline favour fewer, longer sessions over more, shorter ones | IDI |
| The research question is about category perception shared across a market | Focus group |
How many IDIs do you need?
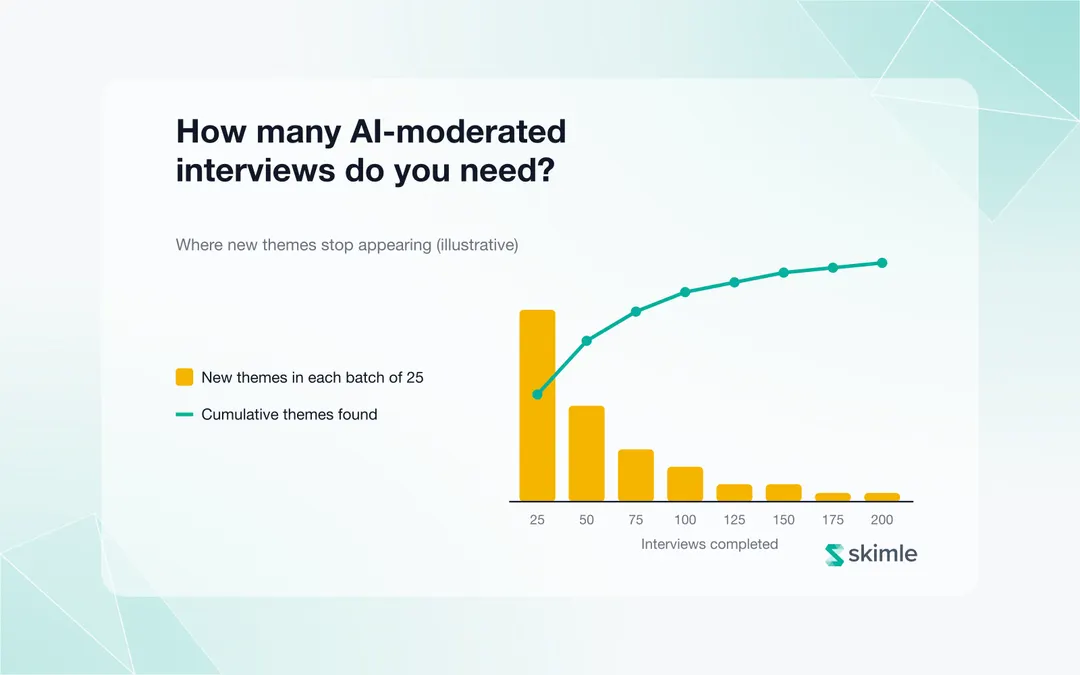
Most commercial IDI studies land between 15 and 30 interviews per segment, though the right number depends on how homogenous your population is and how many segments you are comparing.
The empirical anchor most often cited is Guest, Bunce and Johnson's 2006 study, which found that the large majority of themes in a relatively homogenous sample emerged within the first 12 interviews, with basic elements present after six. That finding is frequently over-applied: it describes a homogenous population studied with a consistent guide, and the number rises quickly once you introduce distinct segments, cultural variation, or a broader research question. Later work distinguishing code saturation from meaning saturation suggests that reaching the point where you understand themes richly, rather than merely having encountered them, takes meaningfully longer.
The practical read for commercial work: 12 is a floor for a narrow, homogenous segment, not a target for a study spanning several customer types. Our qualitative research sample size guide covers the factors that move the number, and our post on data saturation explains the underlying concept most sample-size decisions in IDI research are actually based on.
A practical rule for agency work: budget for the segment with the most within-group variation to hit saturation, then check whether smaller, more homogenous segments actually needed as many interviews as you ran. It is far more common for agencies to run too few IDIs in a diverse segment than too many in a narrow one.
How do you structure an IDI discussion guide?
A good IDI guide is a topic list with room to breathe, not a script. It typically opens broad (warming up, establishing context), narrows into the core research questions with planned probes, and closes with anything unprompted the participant wants to add. Our guide to writing an interview guide covers structure and question types in detail, and the interview guide reference post includes a template with worked examples.
The discipline that matters most for analysis later is consistency: every IDI in a study should touch the same core topics, even if the order and depth vary by conversation, because cross-case comparison depends on having comparable data to compare.
What does the IDI analysis process actually look like?
Step 1: transcribe every interview
Accurate transcription is the foundation everything else depends on. See how to analyse interview transcripts for the full process from raw transcript to synthesis. Skimle includes built-in audio transcription, so recordings go straight into the analysis environment without a separate tool or export step.
Step 2: code each interview against a consistent framework
Whether you build your coding framework inductively from the data or start from a deductive framework based on your research questions, the framework needs to be applied consistently across every interview in the study. This is where manual coding gets slow: a human coder applying the same framework to interview 30 the way they applied it to interview 1 requires real discipline, and consistency tends to drift over a multi-week project.
Step 3: understand each interview on its own terms (within-case analysis)
IDI analysis works at two levels, and skipping the first one is the most common way a study goes wrong. Within-case analysis means understanding each respondent's account as a coherent whole before you start comparing: what is this person's situation, what drove their decision, how do the things they said relate to each other?
This matters because a code applied without the surrounding context can invert a meaning. A respondent who says "price was the deciding factor" while explaining that everything else was equivalent is telling you something quite different from a respondent who says the same words while describing a budget crisis. Read the interview, understand the account, then code it.
Step 4: compare themes across respondents (cross-case analysis)
This is the step that actually produces IDI insight, and it is easy to under-invest in. Reading interview 14 in isolation tells you what respondent 14 thinks. Comparing what respondents 3, 14, and 22 all said about the same topic, and noting where they diverge, is what turns 20 individual conversations into a research finding. Metadata-driven segmentation makes this practical at scale: tag each respondent with attributes (segment, region, usage level, whatever your study captures) and compare theme prevalence across those groups without re-reading the whole corpus by hand.
A worked example
Take a study on why mid-market customers churned from a B2B software product. Three respondents say something about onboarding:
R3 (churned, 40 seats): "We got a welcome email and a link to the help centre. Nobody walked us through it. By the time I realised half the team wasn't using it, we were four months in."
R11 (renewed, 120 seats): "Our CSM ran two sessions with the team in the first fortnight. That made the difference, because people actually knew what to do with it."
R19 (churned, 25 seats): "Onboarding was fine, to be fair. The problem was it never did the one thing we bought it for."
Coding each excerpt to an onboarding category would produce a theme present in all three interviews and suggest onboarding is a churn driver. A closer reading gives you something more useful:
- R3 describes absent onboarding leading to low adoption. Sub-code:
onboarding: self-serve only. - R11 describes high-touch onboarding as the reason they stayed. Same topic, opposite valence, and the account is from a renewer rather than a churner.
- R19 mentions onboarding only to dismiss it as a factor. Coding this as an onboarding-related churn driver would be simply wrong.
The finding is not "onboarding causes churn." It is that self-serve onboarding correlates with churn at smaller seat counts while assisted onboarding correlates with renewal, and that at least one churn case had nothing to do with onboarding at all. Note also that R19's account points to a different category entirely (unmet core requirement), which is the kind of signal a purely topic-based count would bury.
This is why the direction of traceability matters. Being able to jump from a theme to every quote inside it lets you check whether a category actually contains what its label claims, which is exactly the check that separates the real finding above from the misleading one.
Running that check by hand across 20 transcripts is slow, which is why it often gets skipped. Skimle codes a full set of IDI transcripts and keeps every theme traceable to the respondent and quote behind it, so a category that looks tidy can be opened and verified in seconds. See how that fits market research and customer insights teams.
Step 5: trace every finding back to source
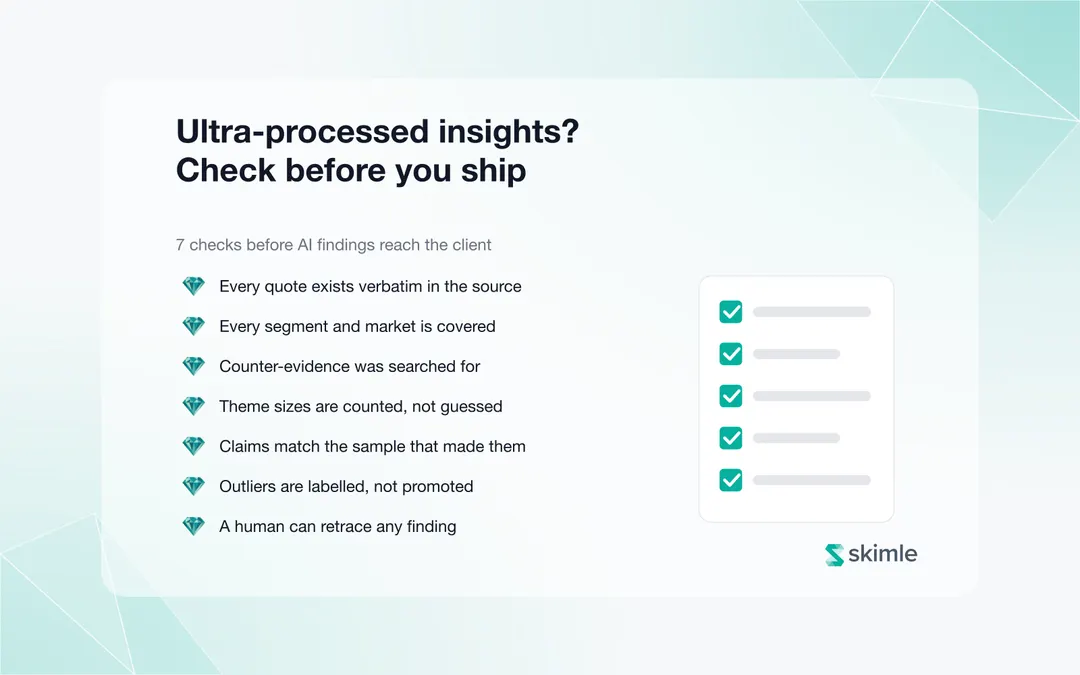
A finding that cannot be traced back to which respondents actually said it is a much weaker basis for a client recommendation than one that can. This is the check worth building into your process regardless of what tool you use: for any theme in your final report, can you point to the specific transcript passages that support it, and can you say with confidence whether it was a majority view or three vocal outliers?
How does AI change IDI analysis at scale?
The mechanical part of IDI analysis, applying a coding framework consistently across many transcripts, is exactly what AI-assisted analysis does well, provided it stays reviewable. Skimle runs automatic thematic analysis across your full set of IDI transcripts, applies categories consistently whether you have 15 interviews or 150, and keeps every theme traceable back to the exact quote and respondent it came from.
Forrester Consulting research found that 84% of decision-makers recognise the value of unstructured data like interview transcripts, yet only 30% of the data organisations actually collect is unstructured, which is a fair description of why IDIs get commissioned in the first place and why the analysis step matters so much: the richest data in most research programmes is exactly the kind that is hardest to process consistently by hand. The global insights industry, where IDI-based studies represent a meaningful share of commissioned work, passed $153 billion (€141 billion) in 2024 according to ESOMAR's Global Market Research 2025 report, and continues to grow.
What AI-assisted analysis should not do is replace the researcher's judgement about what a theme means or whether a client recommendation follows from it. The mechanical first pass and the interpretive final call are different jobs, and a good tool keeps them visibly separate rather than presenting an automated output as a finished analysis. See our guide on what a citation actually proves in qualitative analysis for why that separation matters commercially.
How long does IDI analysis actually take?
Useful for scoping a project and for pushing back on a timeline that was agreed before anyone thought about analysis. Rough figures for a 20-interview study, assuming 45-minute interviews:
| Stage | Manual | AI-assisted |
|---|---|---|
| Transcription | 8–15 hours, or outsourced at roughly $1.99 per minute | Minutes, included in most analysis platforms |
| First-pass coding | 3–5 working days | Under an hour to a reviewable draft structure |
| Reviewing and refining the coding | Included above | 0.5–1.5 working days |
| Cross-case synthesis and narrative | 1–2 working days | 1–2 working days (largely unchanged) |
| Total to debrief-ready | Roughly 5–8 working days | Roughly 2–3 working days |
Notice which row does not shrink. AI removes most of the mechanical time in transcription and first-pass coding. It does not meaningfully shorten the interpretive work of deciding what the themes mean and building the client narrative, which is the part that requires a researcher's judgement. Anyone promising a 90% reduction in total project time is describing the first two rows and quietly ignoring the last one. Our breakdown of what a qualitative study actually costs works through the full economics with 2026 rates.
How should you choose quotes for the client report?
IDIs are commissioned partly because they produce vivid, quotable evidence, and quote selection is where a rigorous analysis can quietly become a misleading one.
Choose for representativeness first, vividness second. The most articulate quote in your corpus is rarely the most typical. When the two conflict, lead with a quote that represents the modal position and use the vivid one as colour, clearly framed as an individual account rather than a summary of the segment.
Report prevalence alongside the quote. "Fourteen of twenty respondents described some version of this; R7 put it most directly" is a defensible construction. A quote presented alone invites a stakeholder to read one person's view as the finding.
Include disconfirming evidence deliberately. If three respondents contradicted your main theme, say so and characterise them. A report with no dissent reads as either a thin analysis or a selective one, and a client who later meets one of those dissenting customers will trust the whole study less.
Never composite quotes. Merging two respondents' phrasing into one cleaner quote is fabrication, even when the underlying meaning is preserved. Edit for length with ellipses if you must, and keep the original traceable.
3 common mistakes when analysing IDIs
Treating each interview as a standalone story instead of comparing across cases. A rich, well-told narrative from one respondent is compelling, but a single compelling quote is not a finding until you know how many other respondents said something similar, and how many said the opposite. Cross-case comparison is the step that turns anecdote into pattern.
Letting the coding framework drift over a multi-week fieldwork period. When IDIs are conducted over several weeks, it is easy for a coder's understanding of a category to shift subtly between interview 3 and interview 25. A framework worth trusting needs periodic checks: re-read an early interview against the framework as it stands now and confirm it still fits.
Skipping subgroup comparison because the aggregate story looks clean. An aggregate theme that looks tidy across all respondents sometimes hides a real split between two segments that cancel each other out in the combined view. Always check whether a finding holds within each segment separately before presenting it as a whole-sample conclusion, particularly when a study spans distinct customer types, regions, or usage levels.
Frequently asked questions
What does IDI stand for in market research?
IDI stands for in-depth interview: a one-on-one, semi-structured qualitative interview used to explore an individual's attitudes, motivations, or experiences in detail, distinct from a group-based method like a focus group.
How long should an in-depth interview last?
Most commercial IDIs run 30 to 60 minutes. Academic or exploratory IDIs, where the goal is deep narrative exploration rather than covering a fixed set of client research questions, can run 60 to 90 minutes or longer.
How many IDIs are enough for a market research study?
Most commercial studies use 15 to 30 IDIs per segment, guided by data saturation (the point where new interviews stop surfacing new themes) rather than a fixed rule. See our sample size guide for the factors that change this number.
Can AI transcribe and analyse IDIs in the same platform?
Yes. Tools like Skimle include built-in transcription, so an audio or video recording can be uploaded directly and analysed without exporting to a separate transcription service first, which removes a manual handoff step that otherwise slows down multi-interview studies.
What is the difference between coding an IDI and coding a focus group transcript?
IDI coding attributes every statement to one individual with no group dynamics to account for. Focus group coding has to handle multiple speakers, crosstalk, and social dynamics like a dominant voice shaping the group's apparent consensus, which is why focus group analysis requires a different approach even when the underlying coding framework is similar.
Ready to analyse your in-depth interviews with speed and rigour? Try Skimle for free and run a real set of IDI transcripts through structured, traceable analysis.
Related reading: Focus groups vs individual interviews, qualitative consumer insights research for market researchers, and our market research tools landscape review. If you work in market research or customer insights, see how Skimle fits your workflow specifically.
Further reading for market research teams: how to write a qualitative topline report in 24 hours.
About the authors
Henri Schildt is a Professor of Strategy at Aalto University School of Business and co-founder of Skimle. He has published over a dozen peer-reviewed articles using qualitative methods, including work in Academy of Management Journal, Organisation Science, and Strategic Management Journal. His research focuses on organisational strategy, innovation, and qualitative methodology. Google Scholar profile
Olli Salo is a former Partner at McKinsey & Company where he spent 18 years helping clients understand the markets and themselves, develop winning strategies and improve their operating models. He has done over 1000 client interviews and published over 10 articles on McKinsey.com and beyond. LinkedIn profile