AI can now analyse 500 interview transcripts or survey responses in under an hour, surfacing themes, frequency counts, and source-linked quotes. For numbers, Excel and BI tools already do the job. The real opportunity is text: Gartner estimates 80 to 90 per cent of enterprise data is unstructured, and most of it has never been analysed. This guide covers how AI handles both data types, which tools fit which task, and a practical text analysis workflow.
What does "AI for data analysis" actually mean?
The phrase covers a broad range of tasks. When most people search for "AI for data analysis," they are thinking about one of two things:
Numeric and structured data (sales figures, survey ratings, web analytics, financial metrics). Here, AI tools help with forecasting, anomaly detection, and automated reporting.
Text and unstructured data (interview transcripts, open-ended survey responses, customer feedback, meeting notes, policy documents, research reports). Here, AI tools identify themes, categorise content, extract key passages, and quantify what was previously impossible to count.
The distinction is fundamental. The tools built for numbers (Python notebooks, Power BI, Tableau) are not designed for text. The tools built for text (qualitative data analysis software, NLP pipelines, purpose-built AI analysis platforms) are not designed for spreadsheets. Understanding which problem you have is the first step to choosing the right tool.
Why unstructured text is where AI made the biggest difference
Organisations have always collected far more text than they could ever read. A mid-sized company running 50 customer interviews per quarter generates 50 to 100 hours of recorded conversation. A policy team receiving a public consultation might receive 10,000 written responses. An HR team running annual employee surveys generates thousands of open-ended comments.
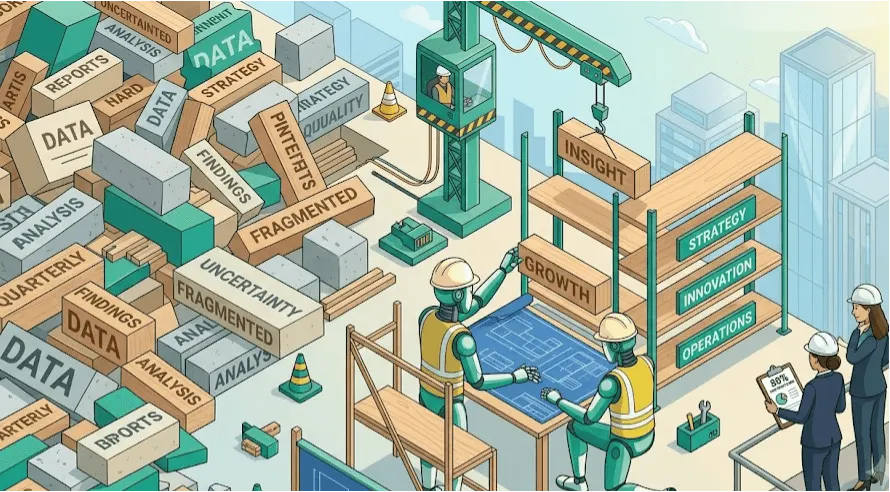
Before AI, the realistic options were: read a sample, ignore the open-text entirely, or hire a team of analysts for weeks. None of these is satisfying.
According to Gartner's Market Guide for Text Analytics, 80 to 90 per cent of all enterprise data exists in unstructured formats: emails, transcripts, documents, feedback forms, social media, and reports. IDC projected that unstructured data would represent 80 per cent of globally collected data by 2025. Despite this volume, the same research organisations note that only a fraction of this data is ever analysed.
AI changed that equation. Modern large language models can read, categorise, and summarise text at a scale and consistency that no human team can match. A dataset that would have taken a researcher four to eight hours of coding work per one-hour interview (meaning weeks of work for a 30-interview study) can now be processed in hours.
The rest of this guide walks through how to think about the distinction between numeric and text analysis, which tools fit which tasks, and what a practical AI-assisted text analysis workflow looks like.
How does AI handle numeric vs text data differently?
The distinction matters because the failure modes are different.
Numeric and structured data
For numbers, AI and traditional software work well together. Spreadsheet formulas, SQL queries, and BI tools handle aggregation, filtering, and visualisation reliably. AI adds value at the edges: writing the SQL you didn't know how to write, spotting anomalies in large datasets, generating narrative summaries of dashboard data, or running regression analysis through a natural-language interface.
ChatGPT's Advanced Data Analysis feature (formerly Code Interpreter) is a good example: you upload a CSV, ask a question in plain English, and the tool writes and runs Python code to answer it. For people who know what they want to find but don't know how to code, this is a real time-saver.
The risk with numeric AI analysis is misinterpretation rather than fabrication. The output is usually a real number, but it might be the wrong number for the question you actually care about. You can check the output against raw data.
Text and unstructured data
For text, the challenge is different. There is no ground truth to check against in the same way. When an AI tool says "theme 4 is about pricing concerns," you cannot verify that claim by looking at a spreadsheet column. You have to go back to the source passages.
This is why traceability matters so much in text analysis. A tool that tells you the themes without showing you which quotes generated them is not auditable. You cannot verify the finding, and you cannot catch the cases where the model has miscategorised a passage or invented a pattern that the data does not actually support.
The best AI text analysis tools (including purpose-built qualitative analysis platforms like Skimle) maintain a direct chain from every theme or category back to the specific source passages. This is what makes AI-assisted text analysis usable in professional and research contexts, and it is a deliberate design decision rather than an afterthought; designing AI for qualitative research explains the principles behind it.
Which tool fits which task? A decision table
| Task | Best tool type | Notes |
|---|---|---|
| Analyse a spreadsheet of numbers | Excel / Google Sheets + BI tool | Pivot tables, charts, aggregation |
| Write SQL or Python you don't know | ChatGPT Advanced Data Analysis | Good for one-off queries; check the output |
| Dashboard and visualisation | Tableau, Power BI, Looker | Designed for structured data at scale |
| Summarise a single document | General chatbot (ChatGPT, Claude) | Fine for a one-off; no traceability |
| Analyse 10+ interviews or surveys | AI-native text analysis (Skimle) | Consistent coding, traceability, theme frequency counts |
| Analyse open-ended survey responses at scale | AI-native text analysis | General chatbots hit context limits with large datasets |
| Extract themes from customer feedback | AI-native text analysis | Needs citation back to source; chatbots don't do this well |
| Mixed methods (numbers + text) | AI-assisted qualitative tools with mixed methods support | Keep tools matched to data type |
The critical column is the "notes" column. Pick the tool that gives you an auditable output for your specific task, not the one that sounds most impressive. If you are new to the QDA software category, what is CAQDAS? explains what these tools do and when you need them.
What can a general chatbot do, and where does it fall short?
Copying a few interview transcripts into ChatGPT or Claude and asking for the main themes works, up to a point. For a single interview or a handful of short documents, a general chatbot can give you a reasonable summary.
The limitations surface quickly as scale increases:
Context window limits. Large language models can only process a certain amount of text in a single conversation. A project with 30 one-hour interview transcripts will exceed the context window of most chatbot interfaces. You can split the data and run multiple sessions, but then you lose cross-document pattern recognition: the model in session 5 does not know what it found in session 1.
No traceability. A chatbot tells you the themes; it does not show you which passages generated them. You cannot verify the finding or spot errors. For customer sentiment analysis, research reports, or any output that will inform a decision, this is a serious problem.
Inconsistency across sessions. Run the same transcripts through a chatbot twice and you will get different themes, differently named and differently weighted. For a systematic analysis, this is not acceptable. Purpose-built tools apply consistent criteria across the full dataset.
No frequency counts or metadata analysis. A chatbot cannot tell you that "pricing concerns" came up in 18 of 30 interviews, or that they were more prominent in interviews with mid-market customers than enterprise. Quantifying themes and slicing by participant metadata requires a structured analysis pipeline.
For more detail on this comparison, can ChatGPT analyse qualitative data? covers the specific failure modes with examples.
A practical 5-step workflow for AI-assisted text analysis
If you have a dataset of text (interview transcripts, open-ended survey responses, customer feedback, focus group transcripts, policy responses), here is a workflow that produces auditable, usable results.
Step 1: Prepare your data
Collect all your documents in a consistent format. For interview transcripts, this means ensuring each file is a readable text format (DOCX, PDF, or TXT; see supported formats for what Skimle accepts). Remove personally identifying information if confidentiality matters, or use an anonymisation tool before uploading.
Label your documents with metadata that might matter for the analysis: participant role, date, geography, department, or any other attribute you might want to cross-reference with the themes you find.
Step 2: Set up your analytical framework
Decide whether you are going in open (inductive) or with a framework already in mind (deductive).
For inductive analysis, you want the AI to surface themes from the data without prior categories. This is useful when you do not know what to expect: early-stage customer research, employee listening, exploratory market research. Skimle's automatic thematic analysis mode works this way.
For deductive analysis, you define a set of categories in advance and ask the AI to sort content into them. This is useful when you have a specific framework: a particular customer experience model, a predefined set of risk factors, a strategy framework. See predefined categories for how Skimle handles this.
Many real-world projects are hybrid: start with an open pass to see what emerges, then refine the category structure before a second pass.
Step 3: Run the analysis and review what comes back
AI generates a first-pass set of themes or categories. Your job at this stage is to challenge them, not to accept them passively.
For each theme: click through to the source passages. Do the quotes actually support the label? Are there passages the AI placed in the wrong category? Are there important nuances the category name obscures?
This review step is where researcher judgement does its most important work. AI provides a structured starting point. The analyst decides what the patterns actually mean. This division of labour, where the tool proposes and the analyst decides, is a core principle of well-designed AI for qualitative research. Skimle's Visualisations let you see frequency counts across the corpus at a glance, which helps you identify which themes are most prevalent and deserve the most attention.
Step 4: Trace back to source and verify
Before you report any finding, trace it to the source data. "Customers frequently mention slow response times" needs to link to the specific passages that support this claim.
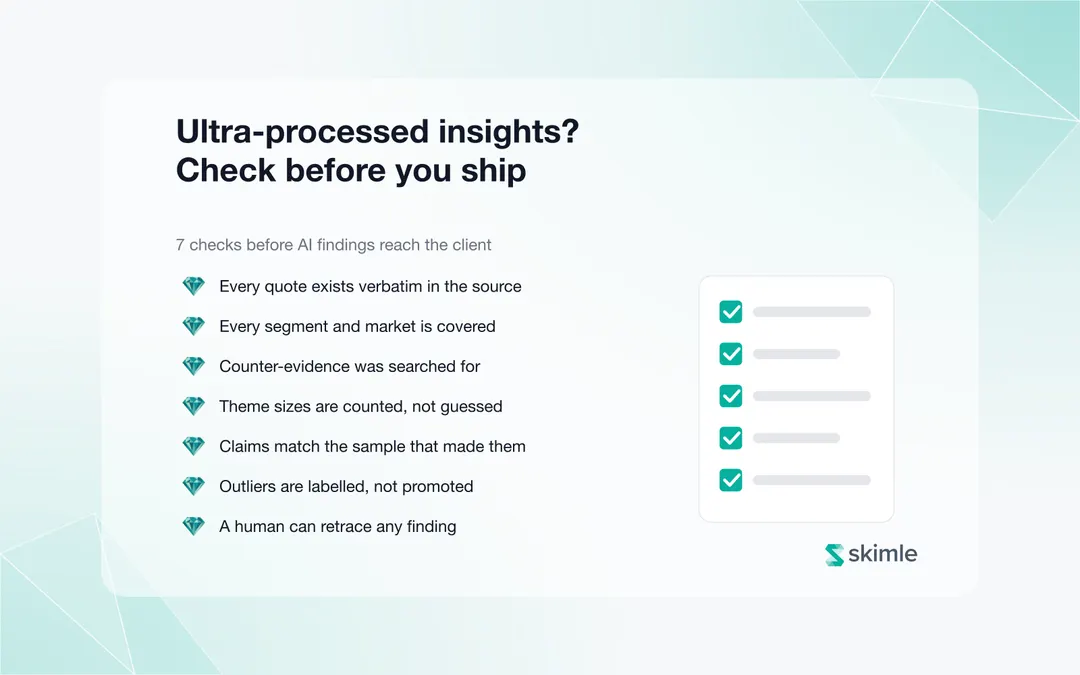
Traceability serves two purposes. First, it lets you check the finding: is "frequent" accurate, or did the AI over-weight one very articulate respondent? Second, it gives you the evidence quotes you will use in your report or presentation.
This step is also where you look for disconfirming evidence: are there passages that contradict the dominant theme? A rigorous analysis acknowledges these, rather than smoothing them out.
Step 5: Quantify and report
Now you can translate qualitative patterns into numbers, where numbers add value. "19 of 30 participants mentioned onboarding difficulty" is more useful in most presentations than "many participants mentioned onboarding difficulty."
Skimle's Visualisations give you frequency counts by theme, and metadata breakdowns let you add the cross-tab: "onboarding difficulty was mentioned by 90 per cent of SMB customers but only 40 per cent of enterprise customers." This kind of insight is almost impossible to surface in manual analysis at any reasonable speed.
For a deeper guide to translating qualitative themes into quantified findings, see how to quantify qualitative data and how to analyse open text responses at scale.
What are the pitfalls of AI text analysis?
Hallucination and theme invention
AI models can generate themes that sound plausible but are not well-supported by the data. This is most likely when the dataset is sparse or when the prompt encourages the model to find a specific number of themes even if the data does not contain that many distinct patterns.
The safeguard is traceability: demand to see the source quotes for every theme before you treat the finding as real. If the tool cannot show you the evidence, you cannot catch the errors.
Black-box outputs
Some AI tools return conclusions without explaining their reasoning or showing the underlying evidence. This is a fundamental problem for any analysis that will be used to inform decisions. If you cannot audit the finding, you cannot stand behind it. Transparency has to be built into the tool from the start rather than added later, a point designing AI for qualitative research makes in depth. Evidence-based strategy from unstructured data covers why this matters in practice.
Sample vs whole-data confusion
A common mistake is running AI analysis on a sample and presenting the results as if they represent the full dataset. If your survey had 2,000 respondents but you uploaded 200, your frequency counts are wrong by a factor of ten.
Be explicit about what your dataset contains and what it represents. AI makes it easy to analyse more data than you could read manually. Use that capability to work with the full dataset rather than a convenience sample.
Over-relying on AI for interpretation
AI surfaces patterns. It does not interpret them. "Pricing concerns came up in 60 per cent of interviews" is a pattern. "Customers do not object to the price itself; they object to the lack of transparency in how the price is calculated" is an interpretation. The second statement requires reading the actual quotes, understanding the context, and applying judgement. No current AI can do this for you.
For researchers worried about rigour in AI-assisted analysis, AI qualitative analysis: hallucinations, context limits, and the black box problem addresses these directly.
When is a general chatbot enough, and when do you need systematic tooling?
This is the practical question most people are trying to answer.
A general chatbot is enough when:
- You have a small number of documents (fewer than 5-10 short ones)
- The output is for your own understanding, not a client report or published research
- You do not need to cite specific passages or show evidence chains
- You are exploring whether a topic is worth investigating, not producing a final analysis
You need systematic tooling when:
- You have more than 10-15 documents or lengthy transcripts
- The output will inform a decision, be shared with stakeholders, or be published
- You need frequency counts, metadata breakdowns, or cross-tabulation
- You need to audit findings (trace every theme back to source quotes)
- You need consistency: the same criteria applied to every document, not conversation-by-conversation variation
For curious professionals doing occasional analysis, a hybrid approach often works: use a chatbot for a first pass to understand what is in the data, then use a structured tool for the systematic analysis that produces the shareable output.
For customer and market researchers running regular qualitative programmes (customer interviews, focus groups, NPS verbatim analysis, win-loss calls), systematic tooling pays for itself quickly in time saved and in the consistency of outputs across projects.
How does AI text analysis connect to the broader data analysis picture?
Most organisations run both types of analysis and rarely connect them. The quarterly NPS survey produces a score (structured) and 800 verbatim comments (unstructured). The score gets into the dashboard; the comments get skimmed by one analyst.
AI makes it possible to bring both together. Analysing the verbatim comments at the same cadence as the NPS score, systematically across the full dataset with frequency counts and participant metadata, means you know not just that the score dropped. You can see that the drop correlates with a specific theme that appeared in 70 per cent of recent low-scoring responses.
This is what evidence-based strategy from unstructured data looks like in practice. The structured data tells you what happened; the unstructured text tells you why.
For a deeper technical look at how AI document analysis works across document types, see AI document analysis: a practical guide. If you are coming from a qualitative research background and want to understand the methodological considerations in more detail, AI in qualitative research: what it can and cannot do and how to do thematic analysis with AI cover those questions with more rigour.
Frequently asked questions
What is the difference between structured and unstructured data analysis?
Structured data is organised into rows and columns: numbers, dates, categories. Unstructured data is everything else: text, audio, images, video. Structured analysis uses tools like Excel, SQL, and BI dashboards. Unstructured text analysis uses NLP, large language models, and purpose-built qualitative analysis platforms. Most organisations have far more unstructured data than structured, but far fewer tools for analysing it.
Can AI analyse qualitative data reliably?
Yes, with important caveats. AI handles the mechanical work of reading, coding, and aggregating text at scale very reliably. What it cannot do reliably is interpret meaning, apply contextual judgement, or decide what a pattern actually means for your specific research question. Reliable AI-assisted qualitative analysis keeps a human in the loop for interpretation and requires traceability: the ability to audit every finding back to source passages.
Is AI text analysis good enough for professional or research use?
Depends on the tool and the workflow. General chatbots are not suitable for systematic professional analysis: they lack traceability, hit context limits with large datasets, and produce inconsistent outputs. Purpose-built tools with structured analysis pipelines, source citation, and consistent categorisation are being used in academic research, consulting, market research, and HR contexts. The key requirement is that every finding can be traced to specific source passages.
How many documents can AI analyse at once?
General chatbots (ChatGPT, Claude, Gemini) are limited by their context window, typically tens of thousands of words before performance degrades. Purpose-built qualitative analysis platforms are not limited in the same way, because they process documents individually and aggregate across them, rather than trying to hold the entire dataset in a single conversation. Skimle, for example, processes each document through its analysis pipeline and maintains the full citation chain regardless of dataset size.
What is the best AI tool for analysing open-ended survey responses?
For small numbers of responses (under 20-30), a general chatbot with careful prompting can work. For larger datasets, a purpose-built text analysis tool that can process all responses consistently, count theme frequency, and let you filter by participant metadata will give you more reliable and auditable results. See the free qualitative data analysis software roundup for options at different price points.
Ready to analyse your text data systematically? Try Skimle for free and upload your interview transcripts, survey responses, or feedback documents to get structured themes with full citation back to source in under an hour.
Related reading:
- AI document analysis: a practical guide
- How to analyse open text responses at scale
- Can ChatGPT analyse qualitative data?
About the authors
Henri Schildt is a Professor of Strategy at Aalto University School of Business and co-founder of Skimle. He has published over a dozen peer-reviewed articles using qualitative methods, including work in Academy of Management Journal, Organisation Science, and Strategic Management Journal. His research focuses on organisational strategy, innovation, and qualitative methodology. Google Scholar profile
Olli Salo is a former Partner at McKinsey & Company where he spent 18 years helping clients understand the markets and themselves, develop winning strategies and improve their operating models. He has done over 1000 client interviews and published over 10 articles on McKinsey.com and beyond. LinkedIn profile