To combine customer insights across channels: define one category structure covering the whole customer experience, tag every document with its channel and segment as metadata, code all sources against that single structure, then compare how each channel weights the same themes. The mistake is running separate analyses per channel. Tools like Skimle keep one framework across interviews, tickets, verbatims and call transcripts in a single project.
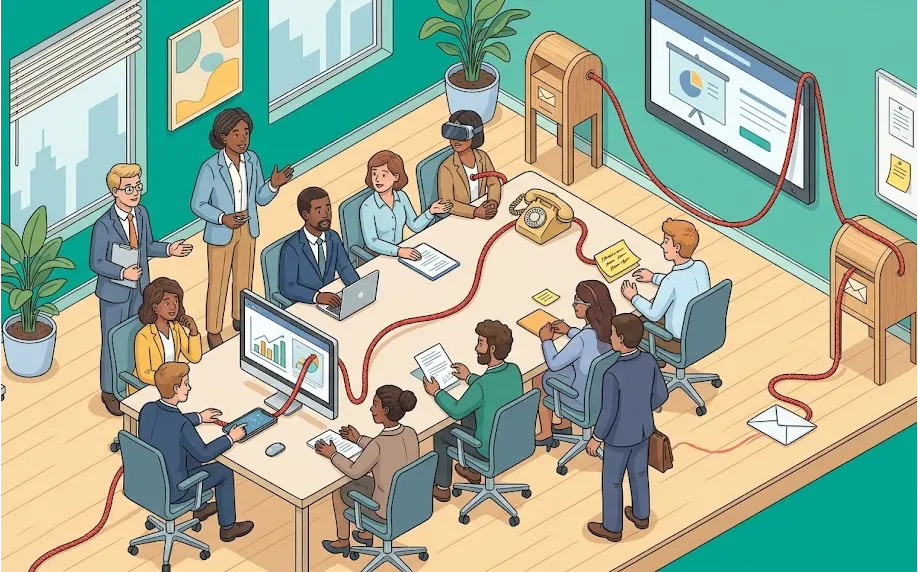
Most insights teams have more customer data than they can use and less insight than they need. The reason is rarely volume. It is that the data arrives in eight different shapes, through eight different systems, owned by six different teams, and gets analysed eight separate times against eight incompatible frameworks. For what that actually costs in re-litigated decisions and duplicated research, see the real cost of a fragmented VoC programme.
You end up with a support dashboard whose top theme is "billing", an NPS deck whose top theme is "value for money", and a research report whose top theme is "customers cannot justify the renewal internally". Those are the same finding. Nobody can see that, because no artefact contains all three.
This guide covers how to fix that: not by buying a platform that ingests everything, but by imposing one analytical structure across whatever you already collect. It is written for customer insights people inside companies and for market researchers running multi-source programmes.
For the wider programme design question, see our voice of customer research guide. This post is about the analysis layer specifically.
Why do multi-channel insights programmes fail to add up?
Three structural problems, in order of how much damage they do.
Each channel gets its own vocabulary. The support team codes tickets against a taxonomy designed for routing, so its categories are operational ("login failure", "invoice query"). The research team codes interviews against a taxonomy designed for understanding, so its categories are motivational ("cannot demonstrate value to my CFO"). Both are correct for their purpose and neither can be compared with the other. When someone asks "is billing our biggest problem?", the answer depends on which taxonomy they happen to be looking at.
Each channel gets its own tool. Support analytics lives in the helpdesk. NPS lives in the survey platform. Call recordings live in the revenue intelligence tool. Interview transcripts live in a research repository or a folder of Word documents. Each of those tools does text analysis of some kind, and each does it against its own private model with its own private categories, none of which export anywhere useful. The tooling actively enforces the fragmentation.
Nobody owns the cross-channel view. Every channel has an owner and the intersection has none. This is why the synthesis, when it happens, is usually a manual exercise: an analyst reads four reports and writes a fifth, which is a summary of summaries with no traceability back to anything a customer actually said.
The underlying data problem is well documented. Analyst estimates put 80% to 90% of enterprise data in unstructured form, and MIT Sloan reports a 2019 Deloitte survey finding that only 18% of organisations were able to take advantage of it. Six years of AI progress later, most insights teams still cannot answer a simple cross-channel question without a week of manual work.
What are the 8 customer feedback channels worth combining?
Not every channel deserves equal weight, and they differ sharply in what they are good for. Here is how they compare.
| Channel | What it is good at | What it distorts | Typical volume | Effort to get analysable |
|---|---|---|---|---|
| Research interviews | Depth, causation, unprompted framing | Small n, recency of recruitment | 10–60 per study | Medium (transcription) |
| NPS and CSAT verbatims | Breadth, trending over time | Extremes over-represented, very short text | 100–5,000 per wave | Low (already text) |
| Support tickets | Frequency of concrete failures | Only surfaces problems, never satisfaction | 1,000s per month | Low (export) |
| Sales and discovery calls | Buying objections, competitive framing | Filtered through what the rep asked | 50–500 per quarter | Low (transcripts already exist) |
| Win-loss interviews | Why deals actually turned | Post-hoc rationalisation | 10–40 per quarter | Medium |
| App store and review sites | Unfiltered public sentiment | Skewed to delight and rage, thin context | 100s per month | Low (scrape or export) |
| Community and forum posts | Emergent problems, workarounds | Power-user bias | Continuous | Medium |
| AI-moderated interviews | Depth at survey scale | Requires good question design | 50–1,000 per study | Low (structured on arrival) |
The point of the table is the second column. Every channel is systematically biased, and the biases differ. Support tickets never tell you what is going well. NPS verbatims are dominated by people who felt something strongly. Sales calls only cover the topics the rep raised. Research interviews are as good as the sample.
Combining channels is valuable precisely because the biases are different. A theme that appears in interviews, tickets and sales calls has survived three different filters and is almost certainly real. A theme that appears only in NPS detractor comments may be real, or may be the loudest 3% of your base.
If you are still building out collection, always-on customer research covers embedding AI interviews across the lifecycle, and Skimle Ask is how we handle the last row in that table.
Why does one category structure matter more than one platform?
The instinct when facing fragmented feedback is to buy an integration layer: something that ingests all eight sources into one warehouse. That solves storage. It does not solve analysis, because the sources still get coded against whatever taxonomy each connector ships with.
What actually creates comparability is a single category structure applied to everything. Get that right and the storage question becomes secondary, because you can export from eight systems into one analysis project and code them together.
A good cross-channel structure has three properties.
It describes the customer's experience, not your org chart. Categories like "onboarding friction", "cannot prove value internally", "missing integration with our stack" travel across channels. Categories like "CS escalation" or "Tier 2 ticket" do not, because they describe your process rather than the customer's problem.
It is stable across time. The value of a cross-channel structure compounds. If you keep the same categories across quarters, you can see a theme growing in support tickets three months before it shows up in NPS. If you rebuild the taxonomy every study, you have a series of unconnected snapshots. This is the single most common way insights teams destroy their own longitudinal value.
It is hierarchical. Two or three levels lets you report at the altitude your audience needs. Leadership wants five top-level themes. The product team wants the twelve sub-themes under "integration gaps". One structure, two reports. Skimle's category management is built for this, and the categories view is where you shape the hierarchy after a first pass.
The practical test of a good structure: hand it to someone from a different team and ask them to code ten pieces of feedback from a channel they do not own. If they can do it without asking you what a category means, the structure travels.
How do you build the combined analysis in 6 steps?
1. Pick a question that spans channels
Do not start with "let's analyse everything". Start with a question that cannot be answered inside one channel: why do mid-market accounts churn in year two, what stops evaluators from choosing us, where does our onboarding actually break. A cross-channel question forces the structure to be genuinely shared rather than one team's taxonomy imposed on everyone else.
2. Export from each system as text plus metadata
Every source becomes a document with attributes attached. At minimum, tag each document with:
- Channel (interview, ticket, NPS, sales call, review, community, Ask response)
- Segment (enterprise, mid-market, SMB, or your equivalent)
- Date or wave
- Lifecycle stage (evaluating, onboarding, established, churning, churned)
- Region or market
- Score where one exists (NPS 0–10, CSAT, deal outcome)
The metadata is what makes the combination analytically useful rather than a pile. Without a channel field you cannot check whether a theme is real or an artefact of one source. Skimle's metadata fields carry these through the whole analysis, and supported formats covers what you can bring in.
3. Draft the category structure before you code
Write down the 6 to 10 top-level categories you expect, drawn from what you already know. Then run an inductive pass with predefined categories, starting from Skimle's suggestions rather than your own list, on a subset (say 30 documents spread across channels) and compare. The gap between what you expected and what emerged is itself a finding, and it tells you which categories to add before committing to the full corpus. Open text analysis: how to find the themes you didn't know to look for covers this inductive-versus-predefined distinction in more depth, since it is exactly what separates a structure that travels across channels from one that only confirms what one team already believed.
4. Code everything against the one structure
Run a predefined category analysis across all documents from all channels in a single project. This is the step that most tooling makes impossible, because support analytics will not accept your interview transcripts and your research repository will not accept 4,000 tickets. A general-purpose qualitative analysis tool will take both.
Expect to iterate. After the first full pass, review the categories that caught very little (too narrow, or the wrong language) and the ones that caught everything (too broad, needs splitting).
5. Compare channels against each other
This is where the value is, and it is the step people skip. For each top-level theme, look at how it is distributed across channels and segments. Four patterns worth naming:
- Confirmed across channels. Appears everywhere at similar weight. High confidence, act on it.
- Channel-specific. Appears heavily in one channel and nowhere else. Usually an artefact of what that channel asks about. Investigate before believing.
- Leading indicator. Rising in tickets or community, absent from NPS. Often the next quarter's problem, visible early.
- Silent in the loud channels. Strong in interviews, invisible in verbatims. Typically something customers cannot articulate in one line, which is exactly what qualitative depth is for.
Metadata analysis is how you slice this, and discovering themes using metadata variables walks through the mechanics.
6. Report the convergence, not the volume
The headline for leadership is never "we analysed 6,000 pieces of feedback". It is "three themes appear consistently across every channel we collect, and here is the one that is growing fastest". Volume is credibility for the method. Convergence is the finding. Our guide on presenting qualitative research findings to executives covers the framing.
What does a combined view actually look like?
A worked example, using round numbers from a B2B software insights programme.
The team pulls 28 customer interviews from the last two quarters, 1,400 NPS verbatims from three waves, 2,100 support tickets tagged as non-technical, 60 recorded discovery calls, and 340 app review comments. Everything gets a channel tag, a segment tag and a wave tag, and all of it is coded against a 9-category structure built around the customer's journey.
The aggregate top theme is "pricing", mentioned somewhere in 22% of documents. Taken alone that is a useless finding, because it points at Revenue with no instruction.
The channel breakdown makes it actionable. In NPS verbatims, pricing complaints are concentrated in SMB accounts and refer to absolute cost. In discovery calls, pricing objections come from mid-market evaluators and refer to the packaging model rather than the number. In interviews, the same mid-market customers describe an internal approval problem: they cannot construct a business case because usage is invisible until after purchase. In support tickets, pricing appears mostly as invoice confusion, which is an operational fix.
Four different problems wearing the same word. The interview channel is the only one that explains the mid-market pattern, and it is also the smallest and most expensive channel. That is the argument for keeping depth research in the mix rather than relying on the cheap high-volume sources.
None of this is visible if the four sources are analysed separately, because each analysis reports "pricing" as its top theme and each is talking about something else.
Which tool can hold every channel at once?
The category of tools that ingest one channel very well is crowded. Support analytics, NPS platforms, revenue intelligence and UX research repositories all do their own slice competently, and all of them assume you only care about their slice.
What a cross-channel programme needs is different:
- Accepts arbitrary text documents from any source, in bulk
- Lets you define and edit your own category hierarchy rather than using a fixed taxonomy
- Carries arbitrary metadata fields for slicing
- Handles both short verbatims and long transcripts in the same project
- Keeps a link from every coded passage back to its source document
- Exports the coded data so it can go into a warehouse or a deck
That list is a description of a general-purpose qualitative analysis tool rather than a channel-specific one. For the landscape, see our complete comparison of qualitative data analysis tools and the interview analysis software comparison for 2026. If you are at a research agency running this for clients, qualitative research tools for market research agencies is the more targeted read.
Skimle is designed for the multi-source case. One project holds interview transcripts, CSV exports of survey verbatims, call transcripts and ticket exports together, all coded against one structure you control, all sliceable by channel and segment. The practical walkthrough is in analysing customer feedback with Skimle, and the customer and market researchers use-case page covers the wider workflow.
It is worth noting where the insights industry is putting its money. ESOMAR's Global Market Research figures for 2024, reported by Research World, put the insights industry at US$153 billion (€141 billion), with research software growing 11.5% to US$62 billion (€57 billion) while traditional market research services grew 4.8%. The growth is in the analysis layer.
How often should you rerun a cross-channel analysis?
Quarterly works for most programmes, with two caveats.
The first is that the category structure should change slowly, and every change should be deliberate and documented. Adding a sub-category is fine. Renaming a top-level theme breaks your trend line, so do it only when the old name is genuinely wrong, and note the change in the report.
The second is that channels have different natural cadences. Tickets and community posts are continuous. NPS runs in waves. Interviews happen when a study is commissioned. Rather than forcing everything onto one clock, keep a rolling project where new documents are added as they arrive and rerun the coding on the increment. That gives you a live picture rather than four snapshots a year.
Teams that get this working usually find the reporting burden falls, because the quarterly deck becomes a delta against a stable structure rather than a fresh analysis every time. On building the surrounding habit, see building a research repository that people actually use.
Frequently asked questions
Should I analyse each feedback channel separately first or all together?
Code everything together against one structure, then compare channels within that structure. Analysing separately first is the mistake that creates the incompatibility, because each separate analysis develops its own vocabulary and there is no reliable way to merge them afterwards. The comparison you want (how does this theme differ by channel) is only possible if the coding was shared to begin with.
How do I handle very different document lengths in one analysis?
Length differences are fine analytically, but they distort frequency counts, because a 60-minute transcript can touch a theme five times while a 12-word NPS comment touches one theme once. Report frequency at the document level (what share of documents mention this theme) rather than the passage level, and always break the count down by channel so the reader can see what is driving it.
Do support tickets belong in a customer insights analysis at all?
Yes, with a caveat. Tickets are the best available measure of concrete, reproducible friction and the worst available measure of overall sentiment, because nobody opens a ticket to say things are working. Use them to establish frequency and specificity for problems surfaced elsewhere, and never use them alone to prioritise, since they will systematically point you at whatever is easiest to complain about.
What is the minimum viable version of this?
Two channels and one structure. Take your last interview study and one wave of NPS verbatims, define eight categories, code both against them, and compare. That takes an afternoon with the right tool and will usually surface at least one theme that neither source revealed on its own. Expand from there rather than trying to onboard all eight channels at once.
How do I stop the category structure drifting between analysts?
Write a one-line definition and one example passage for each category, and keep it with the project. Most drift comes from two analysts having different mental models of a category name, which a worked example resolves immediately. In Skimle, category descriptions live with the categories themselves, so the definition travels with the analysis rather than sitting in a separate document nobody opens.
Ready to put every feedback channel into one analysis? Try Skimle for free. Bring interviews, verbatims, tickets and call transcripts into a single project, code them against one category structure, and slice the results by channel and segment.
Related reading: See our guides on analysing NPS verbatims at scale, how to analyse customer interviews at scale, building a B2B voice of customer programme, and our comparison of Thematic vs Chattermill vs Enterpret for the automated-analytics layer of a multi-channel feedback stack.
About the author
Olli Salo is a former Partner at McKinsey & Company where he spent 18 years helping clients understand the markets and themselves, develop winning strategies and improve their operating models. He has done over 1000 client interviews and published over 10 articles on McKinsey.com and beyond. LinkedIn profile