Categories view
Read a category: what it says, the evidence behind it, and where that evidence came from.
The categories view is where you read one category at a time. It answers the questions you have about a category in the order you tend to ask them: what does it say, what is the evidence, which documents did that evidence come from, and who is over-represented in it.
It is the best starting point for understanding what came out of your analysis.
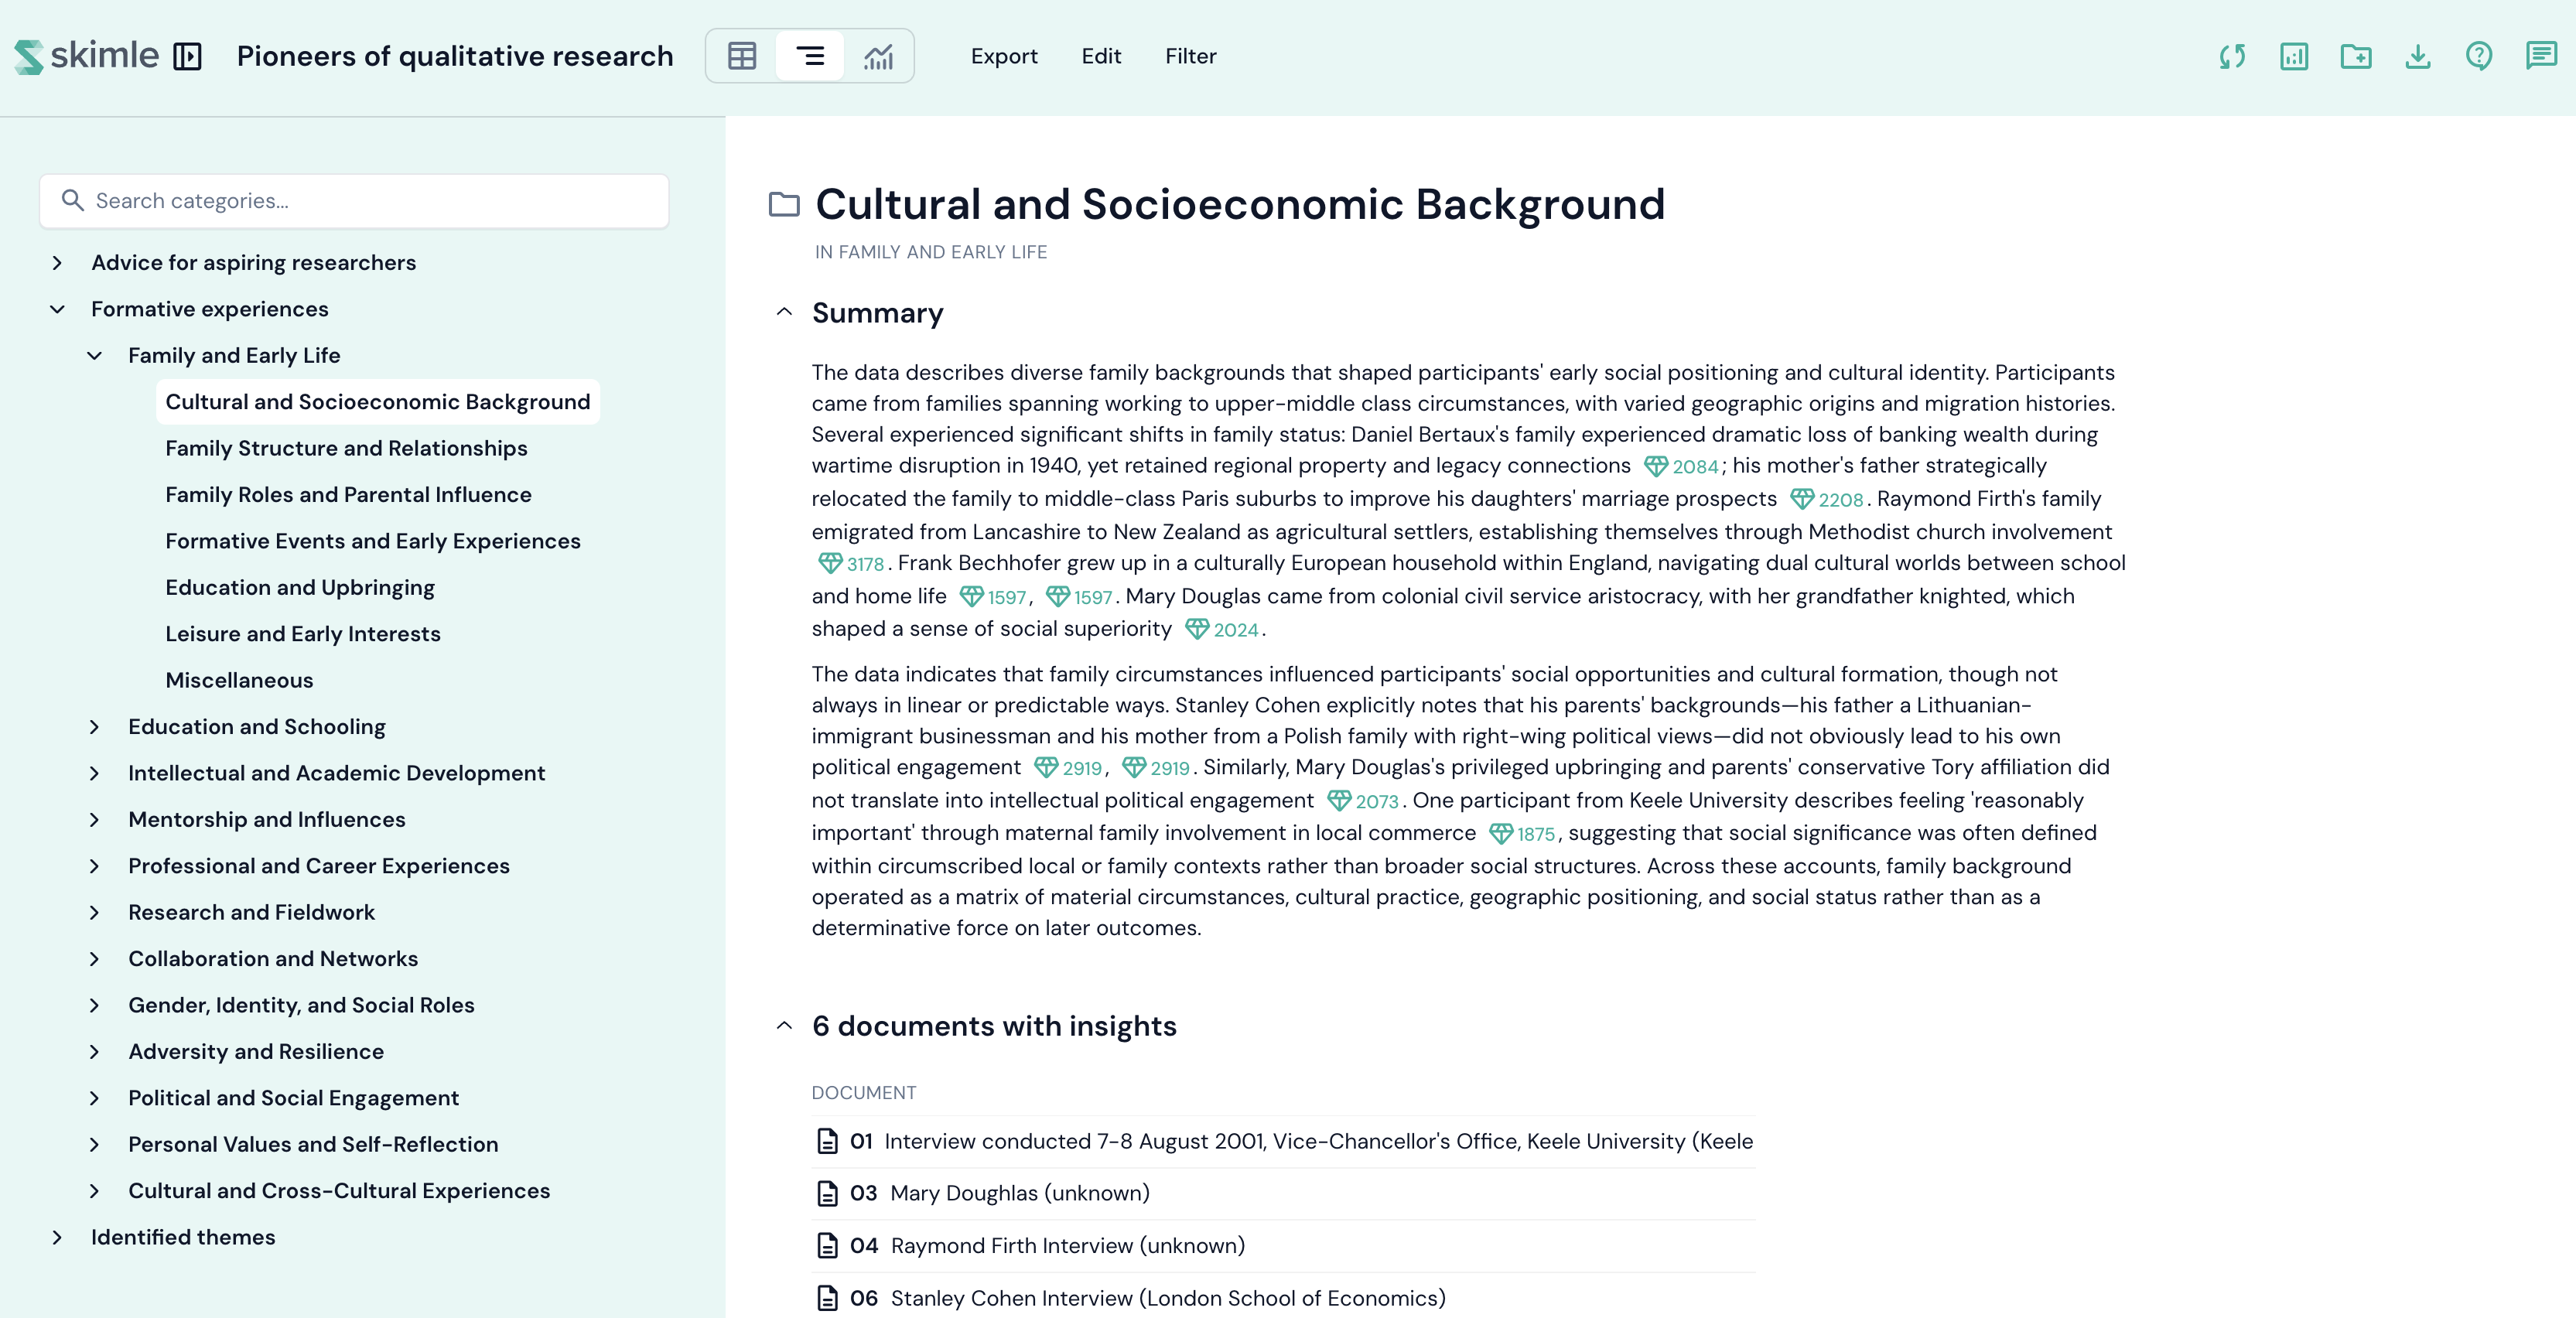
Layout
The view has two panels.
- Left - the tree of your categories and subcategories. Click a category to open it. Click the small arrow to the left of a name to open and close its branch.
- Right - everything Skimle knows about the category you selected, laid out as a set of cards on one scrolling page.
The bar above the cards names each one. Click a name to jump to that card, and it highlights the card you are currently reading as you scroll.
Every card can be collapsed by clicking its title, and Skimle remembers which cards you left open. Cards also carry, in their top-right corner:
- a star, which pins the card to the top of the page so the thing you care about is the thing you land on;
- a download icon, which exports that card alone (the chart as an image, its data as a spreadsheet);
- an enlarge icon on the larger cards, which gives the card the whole page.
Summary
The written summary of the category, generated by the analysis.
The bracketed references in the text are live: click one to open the insight, quote or document it cites, so you can check any claim against the material it came from.
Use Regenerate summary on the card if you have edited the category and want the summary rewritten.
Insights & quotes
The evidence, in two views of the same set. Whichever you use, the filters, the ordering and the grouping stay the same, so the two can never tell you different things.
Quote table lists one row per insight, with every quote behind it and the document each came from. The analysis's own pick comes first.
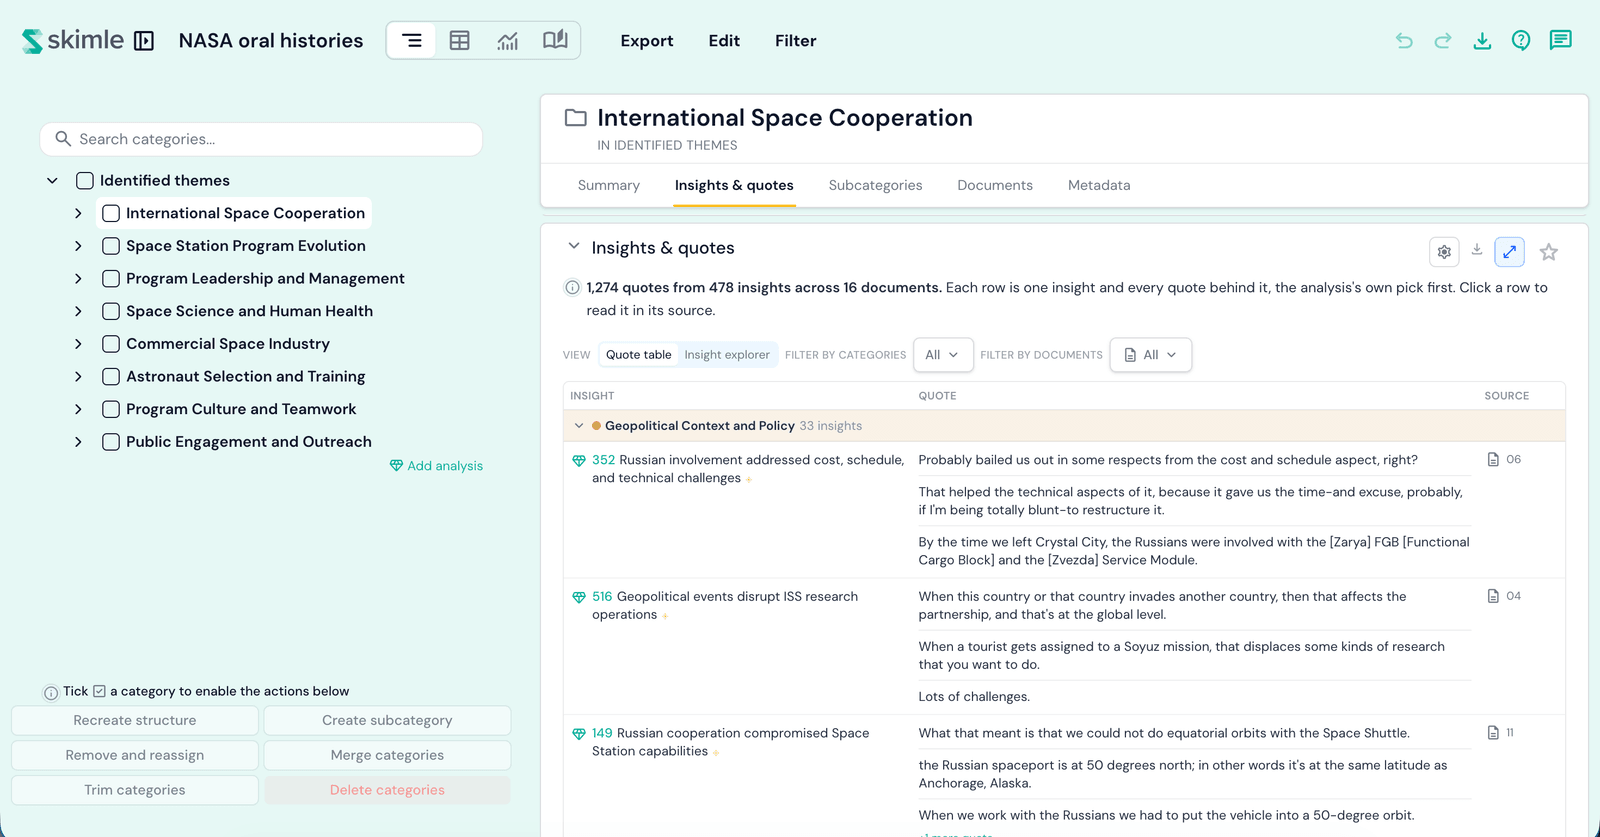
Insight explorer puts the insights in a list on the left and the source document on the right. Click an insight and the document scrolls to the exact place the quote was said, highlighted where it sits.
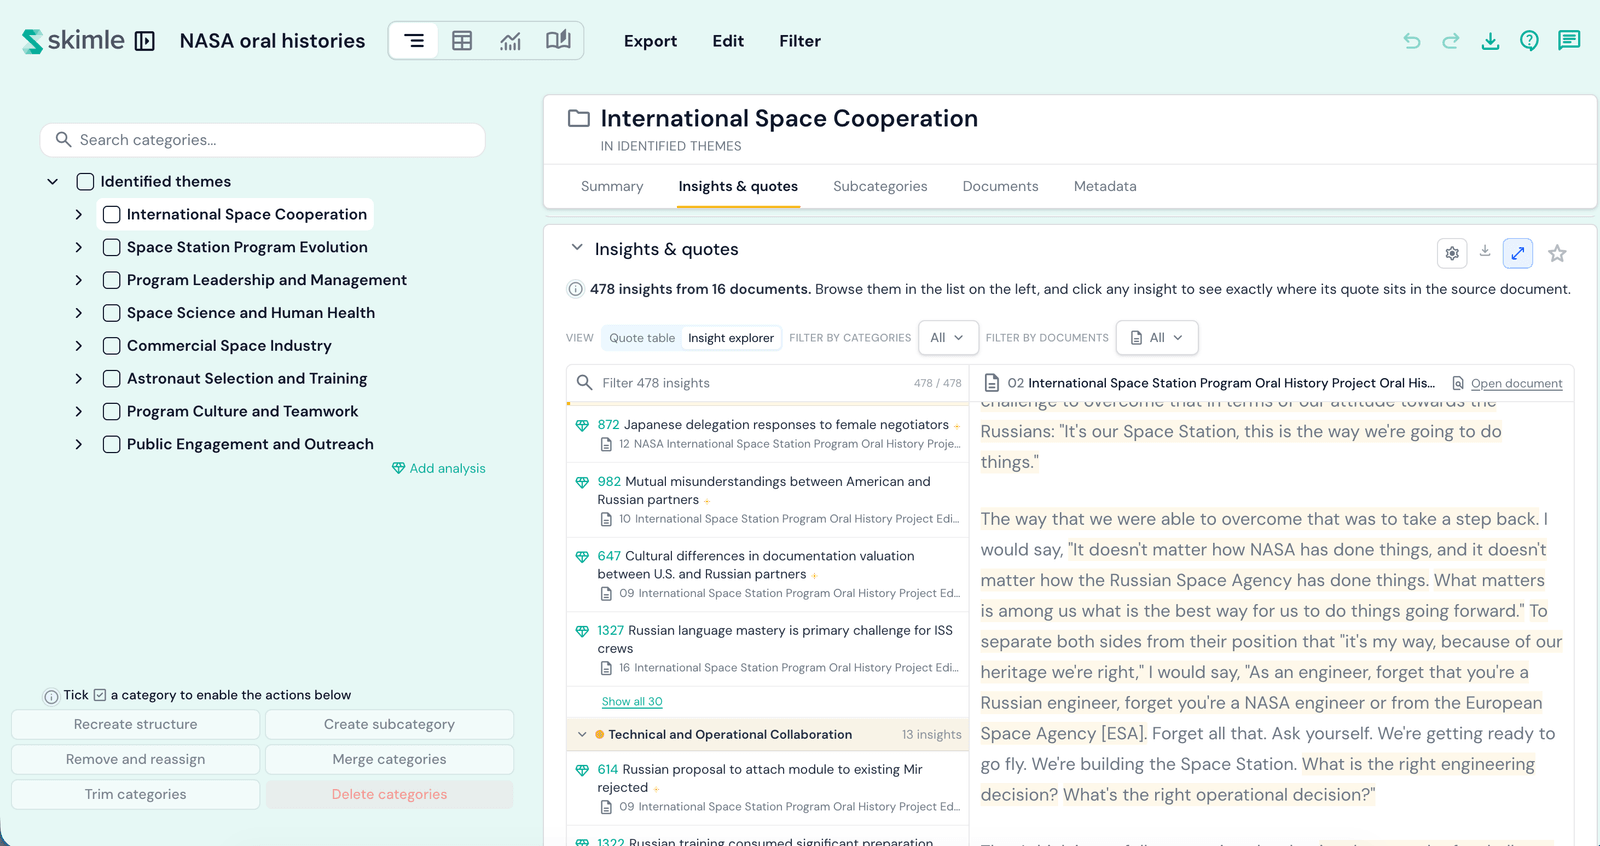
Both views group the insights by subcategory, with a count on each band. Fold a band away and it stays folded when you switch views.
What you can do here:
- Click a row, or a quote to open the Insight explorer on that insight, with its quote highlighted in the source.
- Click the insight itself to open its card, where you can rename it, tag it, note it, or delete it.
- Click the source to open the document's card, with a link to the whole document.
- Filter by categories and filter by documents, above the table, to narrow both views at once.
- Use the gear for sorting, how many rows to show per subcategory, and filtering by metadata.
- Drag any insight onto a category in the tree to file it there. See working with insights.
Subcategories
How this category's evidence is distributed across its subcategories: one bar per subcategory, and a bar for any insights coded directly onto the category itself.
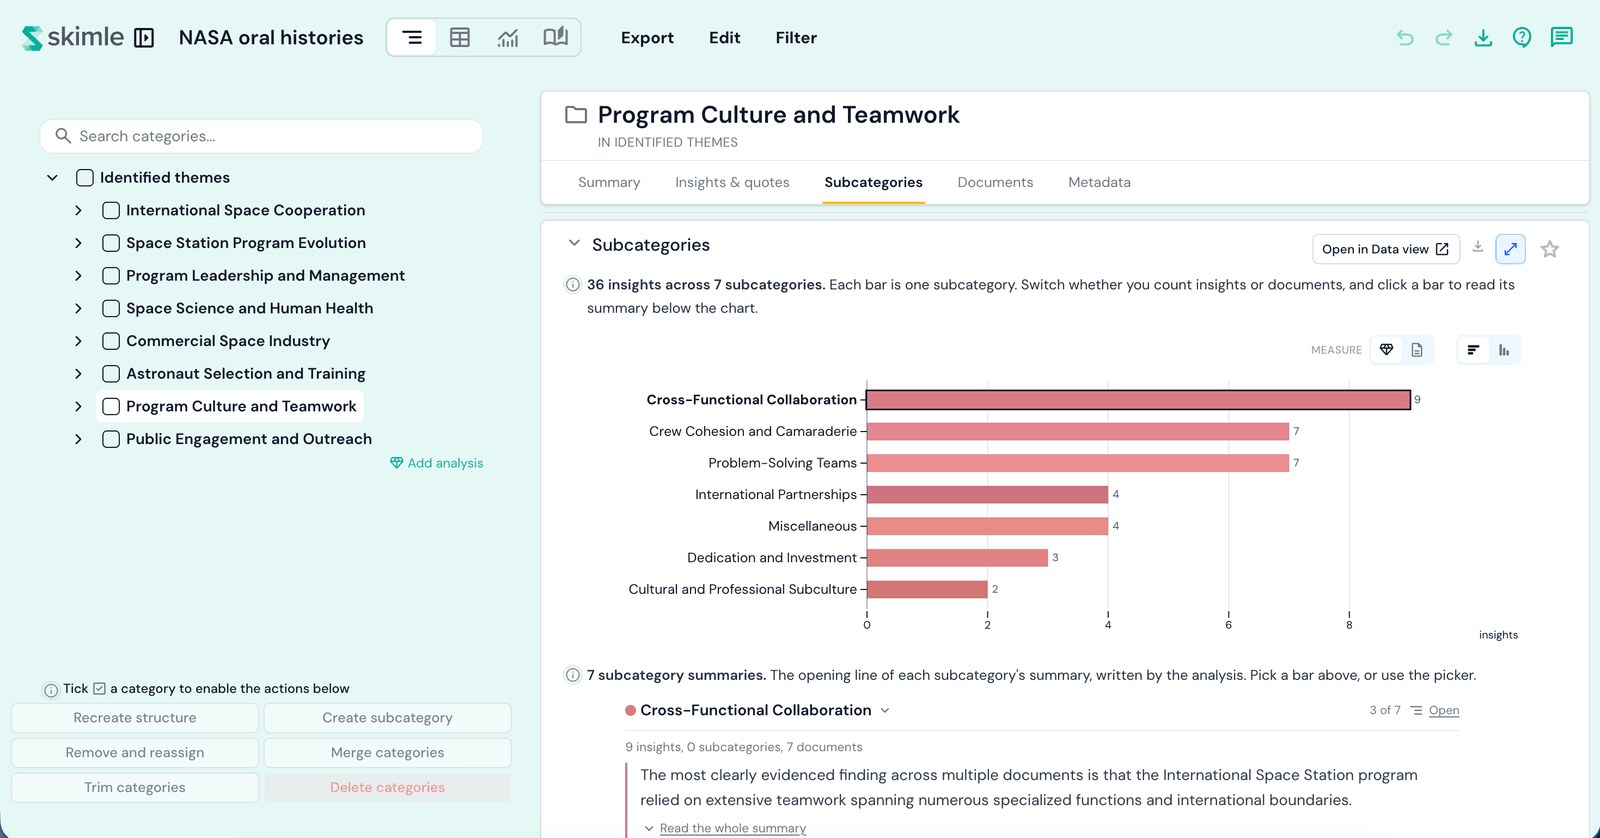
Switch between counting insights and counting documents, change the orientation, and click any bar to read that subcategory's summary below the chart. Open in Visualisations takes the same breakdown into the visualisations, where you can compare it against everything else in the project.
Documents
Which documents this category was built from, and how much each one contributed.
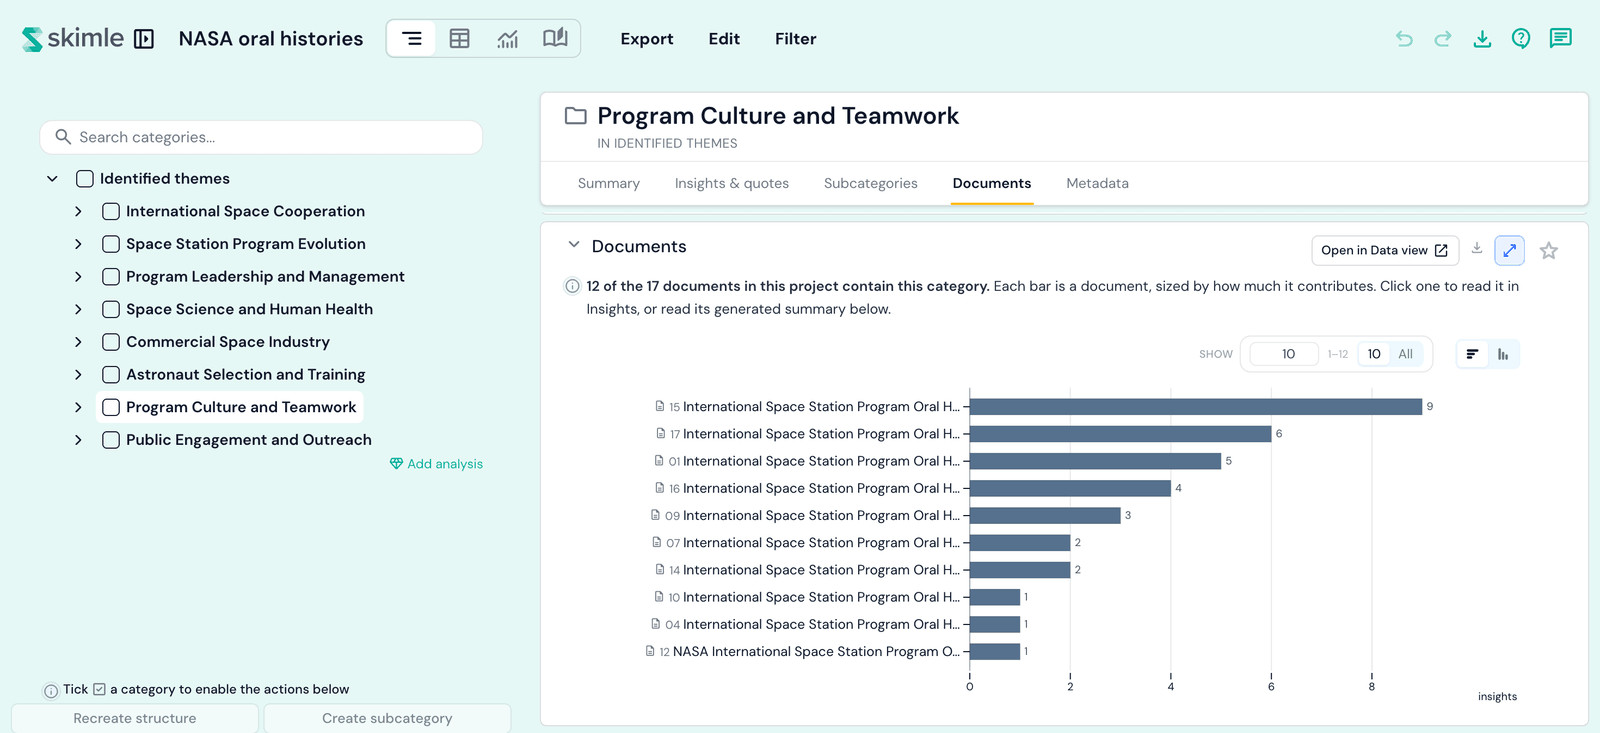
Click a bar to narrow the Insights & quotes card to that document alone.
Beside the chart, Skimle shows the per-document summary: what this category looks like inside that one document, together with the quote the analysis judged most representative of it there.
Per-document summaries are written for the subcategories that actually hold the insights, not for a category that only groups other categories together. So on a top-level category you will not see them - open one of its subcategories and they are there.
Metadata
How the documents behind this category differ from the rest of the project, field by field.
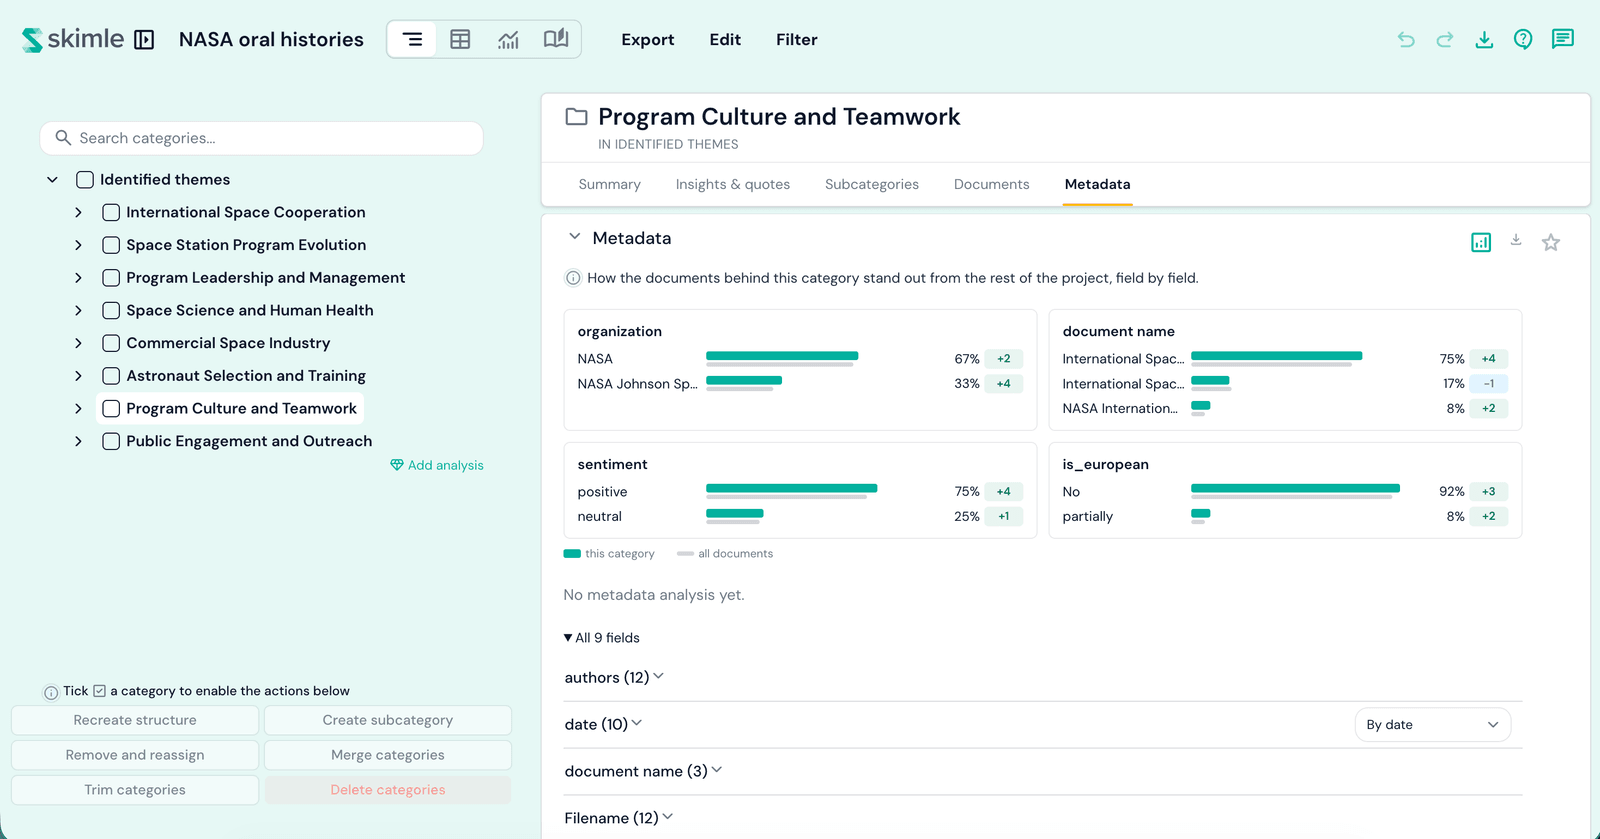
Each field shows the values of the documents in this category against the values across all documents, so you can see who is over-represented here. A +4 beside a value means this category leans towards it far more than the project as a whole does.
Run a full metadata analysis from the card to get written findings rather than only the distributions. See metadata analysis.
Agentic analysis
When a category is part of an agentic analysis, a further card appears listing the claims that analysis reached about it.
Each claim carries how well the evidence supports it, and whether it is something you can act on, a constraint to plan around, or context. Open one to read the whole argument, its evidence table, and the evidence that argues against it.
Claims that the analysis reviewed and rejected are not listed.
A note on filtering
The Filter control at the top of the app narrows the whole project. The filters inside the Insights & quotes card narrow only what that card shows. Whatever is being hidden is always named, so nothing disappears silently.