Spreadsheet view
Browse your documents and insights in a familiar grid layout.
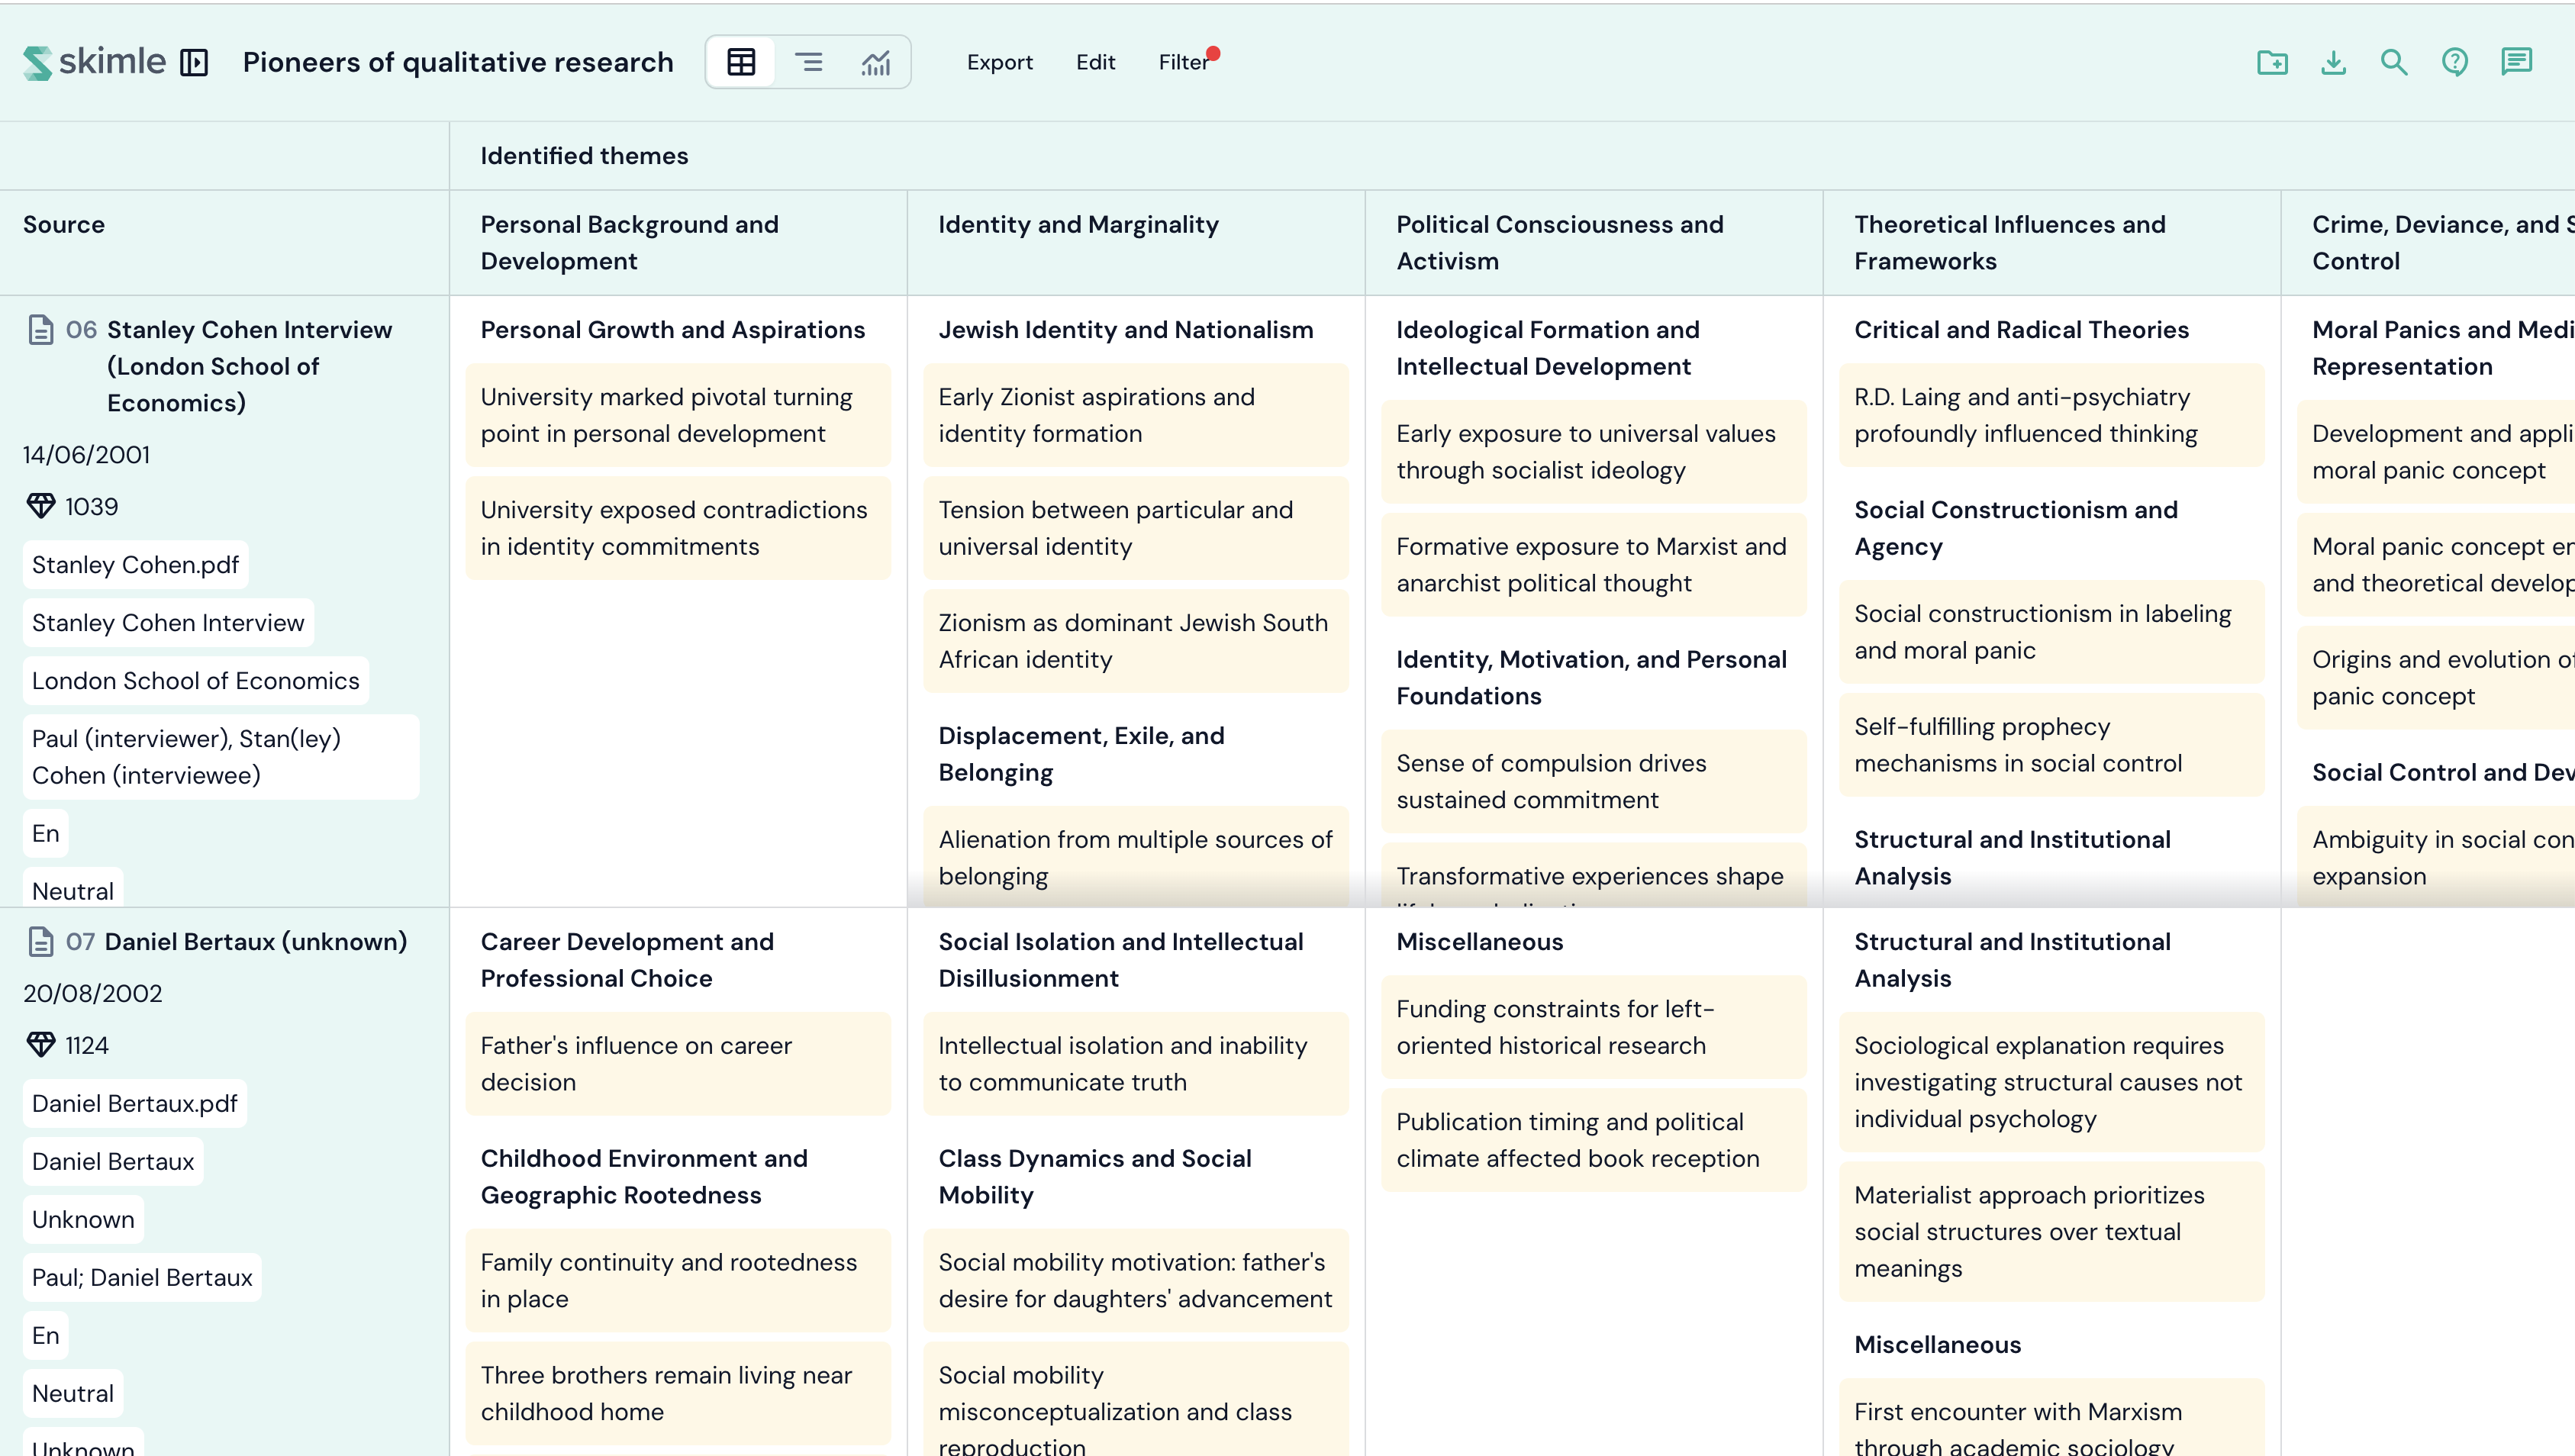
The spreadsheet view presents your entire analysis in a table format, with documents as rows and insight categories as columns. It is ideal for smaller datasets where you can scanning across your data and spot patterns at a glance. However, as your dataset grows in size, the spreadsheet view may become overwhelming. In that case, you may want to use the categories view instead.
Layout
- Rows represent your documents (or memos).
- Columns represent insight categories, organised hierarchically. Metadata fields can also be shown as columns.
- Cells display the insights that were extracted from a given document and assigned to a given category.
The first column shows document names and stays visible as you scroll horizontally.
Filtering and searching
You can narrow down what the spreadsheet displays:
- Search — use the search button in the header to filter insights by text.
- Filter categories - use Filter -> By insight type... to filter insights based on the category tree.
- Tag filter — filter documents and insights by their assigned tags.
- Column-level filters — click on "Sources" or category names to add text-based filters.
Working with the spreadsheet
- Click on a document name in the first column to see details of the document and its metadata.
- Click on an insight within a cell to see its details, quotes, and category assignment.
- Resize columns by dragging the column borders. Column widths are remembered for your session.
- Sort by any column to reorder documents based on their insight counts.
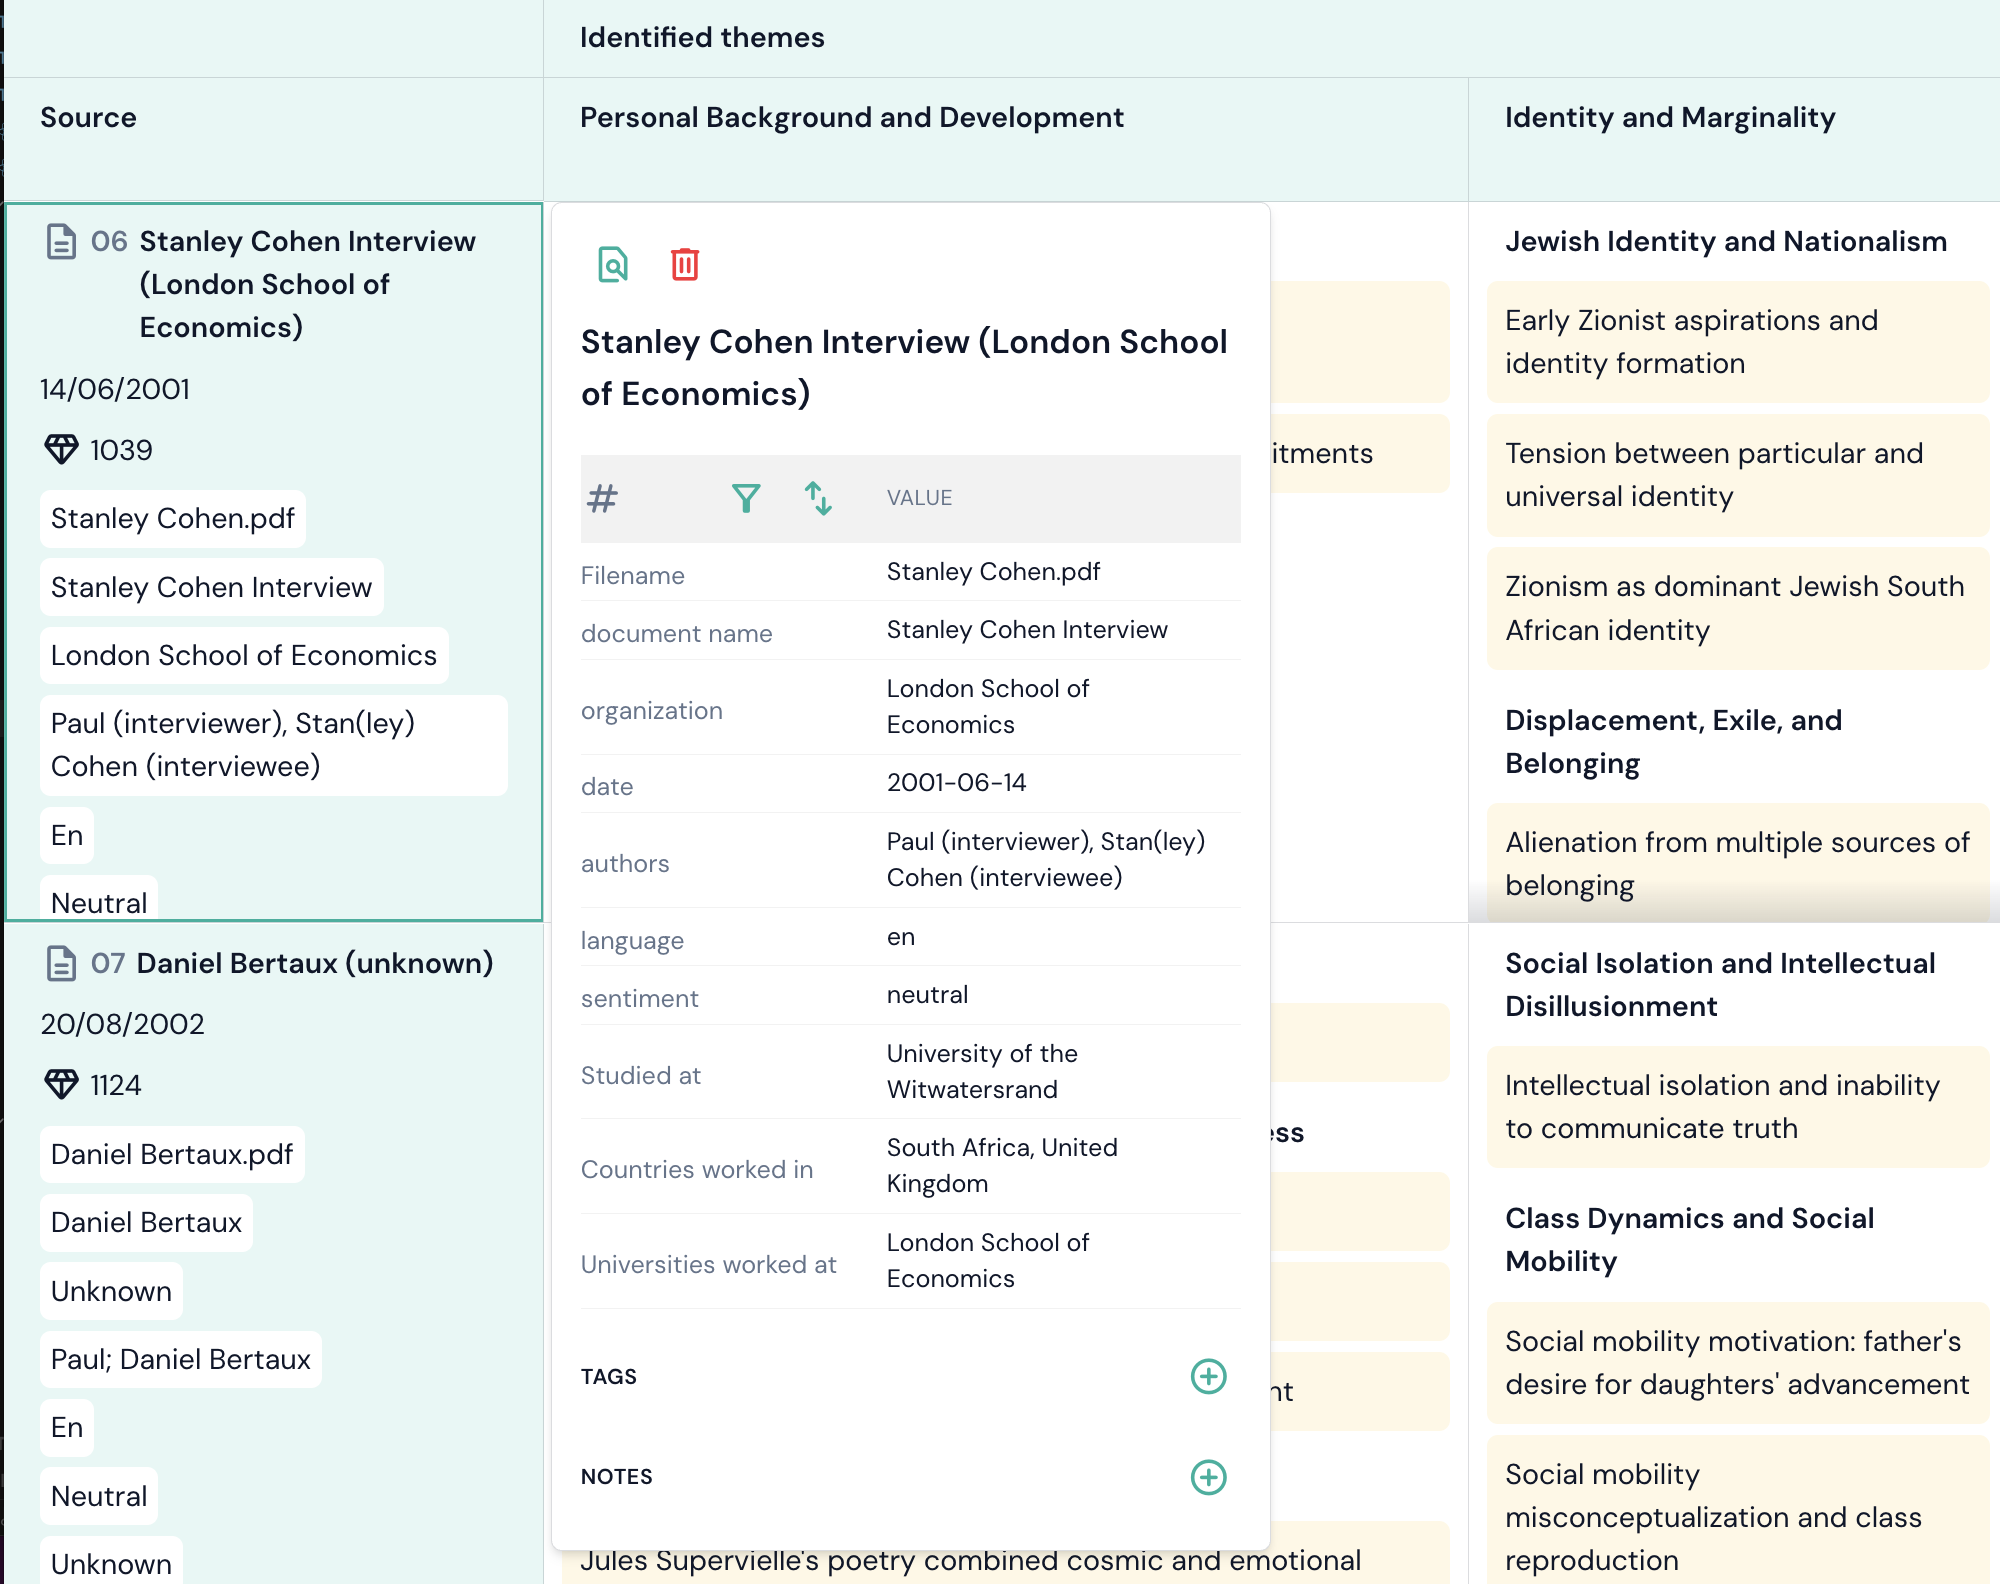 Clicking the document name will open a popup with details. Click on the magnifying glass icon to open the document view. Trashcan icon deletes the document from the project.
The spreadsheet view is often the first place you visit after an analysis completes, as it gives you an immediate overview of how insights are distributed across your documents and categories.