Compare periods
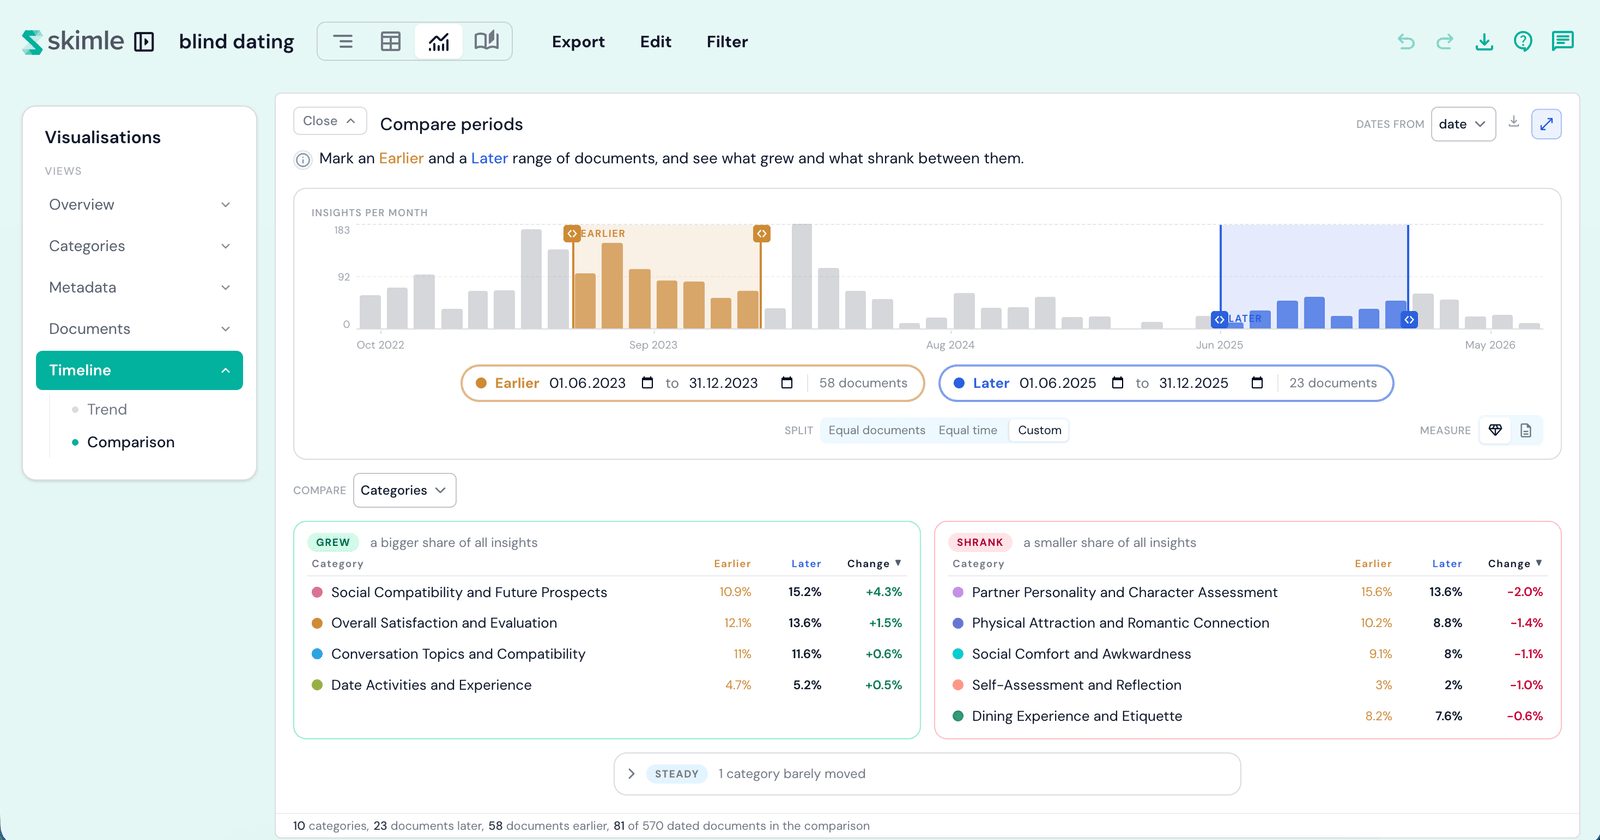
Mark an Earlier and a Later range of documents and see which categories grew or shrank between them.
Compare periods answers the question: what changed? Mark an Earlier and a Later range of documents, and the widget shows which categories grew and which shrank between them. It lives in the Timeline lens of Visualisations, and needs analysed documents that carry dates - the Dates from picker in the card header chooses which date field is used, shared with timeline trend.
Marking the ranges
The strip at the top is the control: every dated document on a calendar, with the two ranges drawn over it. Bars take the Earlier colour, the Later colour, stripes where the ranges overlap, and grey outside both.
- Handles - drag a range's edge handle; it snaps to whole periods.
- Typed dates - type exact dates into the pills below the strip; a typed end day is included in the range.
- Split presets - Equal documents puts the same number of documents on each side (equal evidence, unequal time). Equal time cuts at the calendar midpoint (equal time, unequal evidence). Custom is clickable too: it adopts the current boundaries as your own, ready to adjust. Dragging a handle or typing a date also switches you to Custom.
Gaps and overlaps
The comparison is honest about what it counts. Documents that fall between the two ranges drop out of the comparison entirely, and documents under an overlap count in both groups - a note on the strip tells you how many.
The tables
Below the strip, two columns: Grew and Shrank. Each number is the category's share within its own range, and Change is the difference between the two in points of share - a category on 11.6% earlier and 14.0% later shows +2.4%.
- Sorting - click a column header (Category, Earlier, Later, or Change) to sort by it; click again to flip the direction.
- Badges - New marks a category that appears only in the later period, Gone one that appears only in the earlier period. Steady categories moved by less than the data can resolve; they fold away behind a "barely moved" note you can expand.
- Rows - the Compare control sets what the rows are: categories, subcategories, or the values of a metadata field you pick.
Drilling in
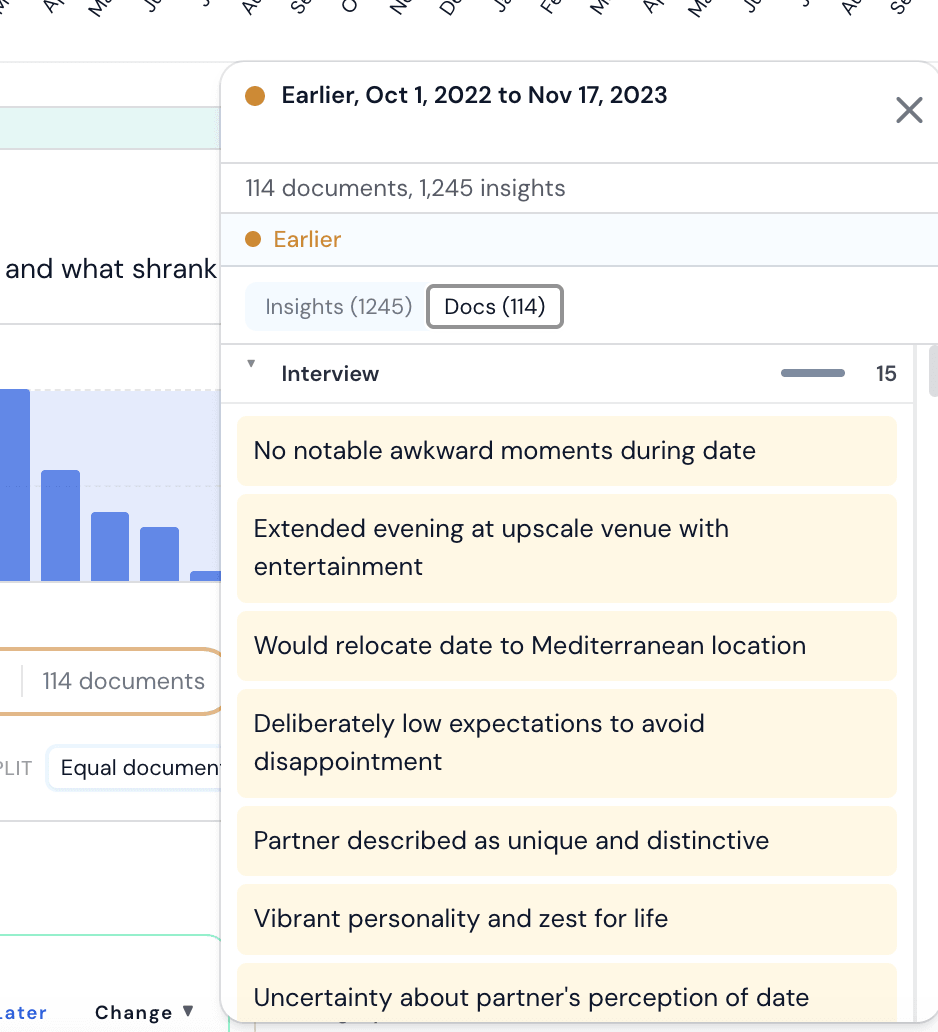
- Click a range pill's document count to open everything the range holds - its documents and their insights.
- Click a bar on the strip to see that period's documents.
Measure
The Measure toggle on the strip's control row sets what both the strip and the tables count: Insights counts every insight, so a document with several insights counts several times; Documents counts each document once, however many insights it has. Documents greys itself out when a range holds too few documents to divide by, and the comparison falls back to insights.
Export
Export the figure as a PNG, or the rows as CSV, from the card's menu. The CSV carries more than the screen shows: each row's 95% confidence interval and p-value ride along, so you can report the changes with their uncertainty.